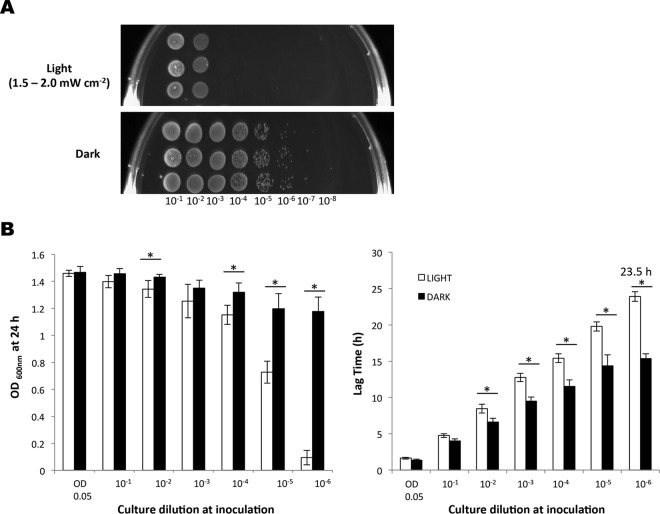
FIG 2.
Cell density influences the extent of growth inhibition of EGD-e by blue light. Dilutions of EGD-e were illuminated with blue light (460 to 470 nm, 1.5 to 2.0 mW cm−2) either on BHI agar (A) or in BHI liquid culture (B). (A) Overnight cultures were standardized to an OD600 of 1.0 and diluted to 10−8. Four microliters of each dilution was spotted in triplicate onto BHI agar and grown at 30°C for 24 h. (B) White bars represent growth in the presence of light, and the black bars represent the dark control. The graphs show final OD600 measurements (left) and lag times (right). The number over the lag time indicates the time taken to reach an OD600 of 0.1. Starting cells were equalized to an OD600 of 0.05 and diluted to 10−6. Cultures were grown in 96-well plates at 30°C for 24 h. The values represent the means of the results from three individual replicates. The error bars represent the standard deviations between replicates. Student's t test was carried out to determine the statistical difference (P ≤ 0.05, indicated with an asterisk) between cultures grown in light and dark.

