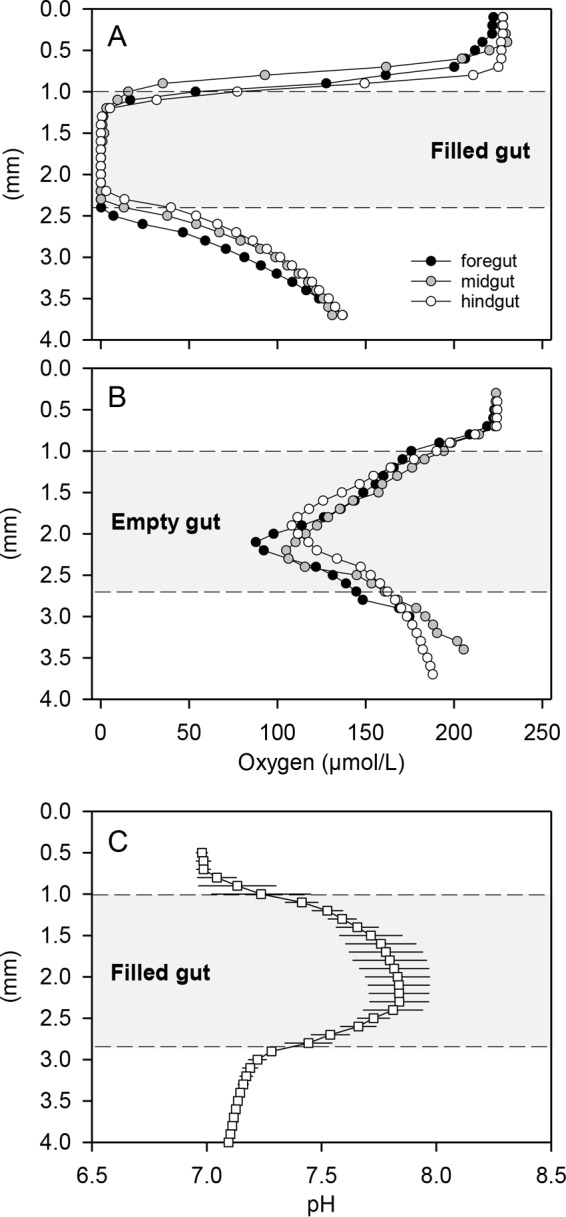
FIG 2.

Radial microprofiles of O2 and pH through dissected guts of L. vannamei. Guts were fixed on agarose in a flow cell that was continuously supplied with air-saturated Ringer's solution. Gray area, gut interior; dashed lines, gut walls; upper white area, Ringer's solution; lower white area, agarose. (A) Oxygen concentration profiles through filled foreguts, midguts, and hindguts. (B) Oxygen concentration profiles through empty foreguts, midguts, and hindguts. In panels A and B, single representative profiles are shown. (C) pH profile (mean ± standard deviation [n = 6]) through filled guts, calculated from pH profiles measured in foreguts, midguts, and hindguts.
