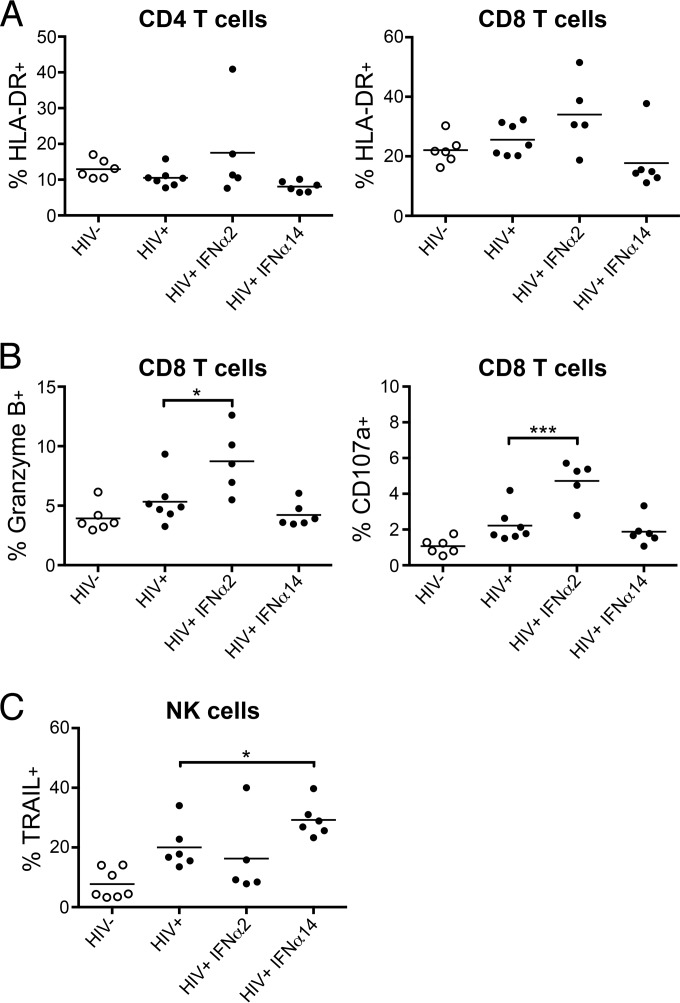
FIG 6.
IFN-α-induced changes in cell-mediated responses. Flow cytometry was used to analyze activation and functional markers on T cells and NK cells. (A) Frequency of activated (HLA-DR+) CD4 and CD8 T cells in spleens of mice from each treatment group at 11 dpi. (B) Frequency of splenic CD8+ T cells positive for cytoplasmic Granzyme B and membrane-bound CD107a at 11 dpi. Statistical analyses were done by one-way ANOVA with Dunnet's posttest. ***, P < 0.001; *, P < 0.05. (C) Percentages of splenic NK cells expressing the cytotoxic effector molecule TRAIL at 11 dpi. *, P < 0.05 (t test between HIV-1+ mock-treated and IFN-α14-treated groups). The horizontal lines denote the means. Each dot represents a separate mouse.

