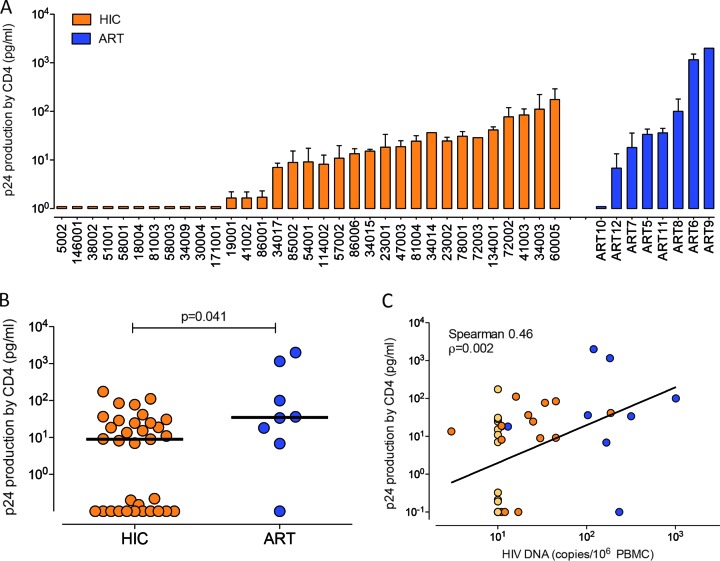
FIG 2.
UCA. The UCA was performed with CD4+ T cells isolated by negative selection from cryopreserved PBMCs from 33 HICs and 8 cART patients. (A) Each bar corresponds to one subject and represents the median level of HIV-1 p24 in positive wells. (B) Comparison of levels of p24 production in the UCA with cells from HICs (n = 33; orange) and cART patients (n = 8; blue). Each circle represents one subject, and the lines indicate mean values. The P value was calculated using the Mann-Whitney test. (C) Correlation between the PBMC HIV DNA load and the level of p24 production by CD4+ T cells. Light-colored symbols, cells with HIV DNA levels below the limit of detection, corresponding to HICs; line, data fit to a linear regression. The frequency of p24 positivity was calculated as follows: (number of p24-positive wells/total number of wells tested) × 100. Virus production in the UCA was calculated as the median level of p24 production in positive wells.

