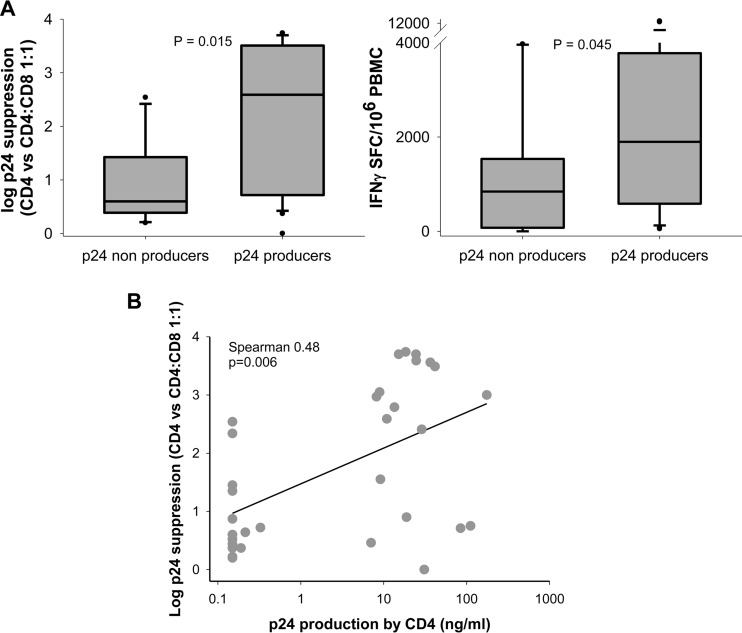
FIG 4.
HIC HIV-specific CD8+ T cell responses according to the amount of p24 produced by their CD4+ T cells in vitro. The responses of HIC CD8+ T cells tested in the UCA were analyzed ex vivo. HICs were classified as p24 producers or nonproducers depending on whether or not p24 was produced by their CD4+ T cells in the UCA. (A) (Left) CD8+ T cell capacity to suppress infection of autologous CD4+ T cells, as measured by the decrease in the level of p24 production in the presence of unstimulated autologous CD8+ T cells (n = 32; one value is missing, owing to unsuccessful CD4+ T cell infection). (Right) Frequency of IFN-γ-producing cells after PBMC stimulation with optimal HIV-1 peptides. The box plots represent the medians; 10%, 25%, 75%, and 90% ranges; and outliers. SFC, spot-forming cells. (B) Correlation between CD8+ T cell capacity to suppress HIV-1 infection and p24 production by CD4+ T cells. Each symbol represents one HIC. The line indicates data fit to a linear regression.

