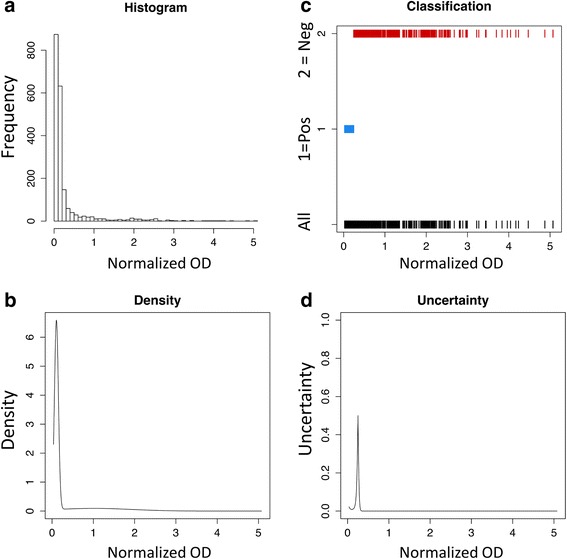
Fig. 2.

a Histogram of normalized absorbance (OD) for horseradish peroxidase (HRP) Ov16 enzyme-linked immunosorbent assay (ELISA) data for participants with Ov16 ELISA results (n = 2,005). b Density profile for HRP Ov16 ELISA data used for the expectations maximization (EM) mixture model. c Classification of specimens for seropositivity resulting from the EM model: 1 represents seropositive, 2 represents seronegative. d Uncertainty profile from EM specimens
