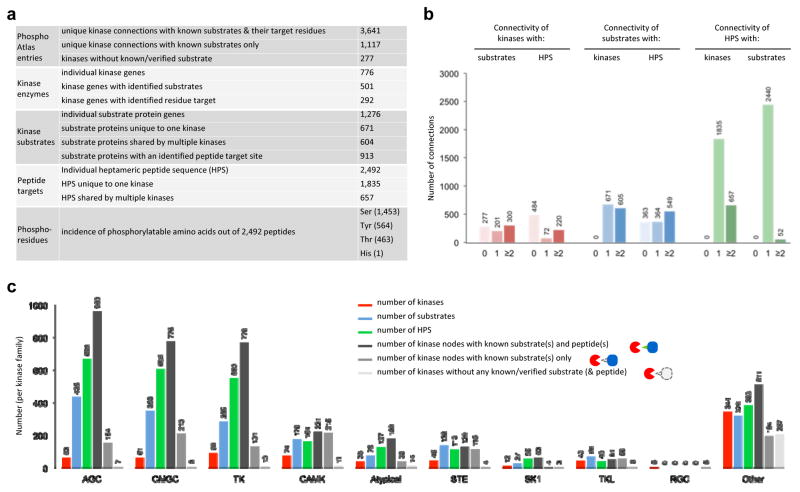
Figure 2. PhosphoAtlas database overview.
a. Table summary of PhosphoAtlas entries.
b. Representation of connections between kinases, substrates and heptameric peptide sequences (HPS’s.). Connecting substrates and HPS’s are depicted for all kinases within PhosphoAtlas depending on the known number of connections for the kinase (left panel), and similarly shown for substrates (center) and HPS’s (right). Data presented for substrates and HPS’s exclude substrates and HPS’s that have yet to be conclusively mapped to kinases.
c. Breakdown of most represented kinase families in PhosphoAtlas by the number of unique kinases per family (red), respective interacting substrates (blue) and their known target peptides (green). Bars in gray shade represent kinase families by status of entries: kinase nodes with known both substrates and peptides, with known substrates only, or without known substrates or target peptides. Kinase enzyme families groups are based on (21).

