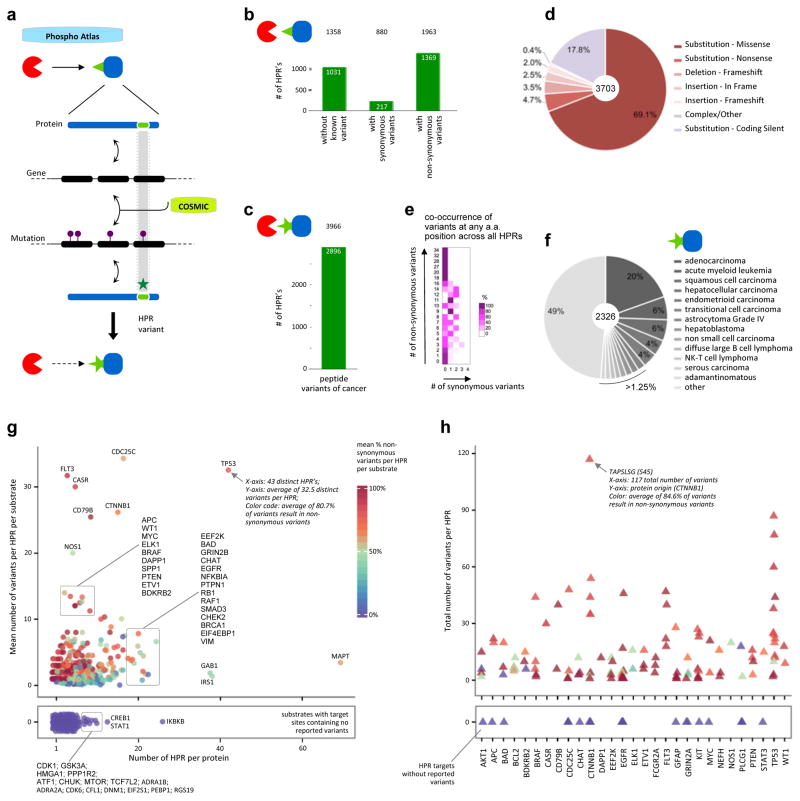
Figure 5. Impact of non-synonymous variants identified as genetic mutations found in tumors.
a. Reverse mapping approach to reveal the cancer-associated variants embedded within the phospho-reactome. The identification of cancer-associated genetic mutations as reported by COSMIC that exert specific effects on kinase-substrate catalytic interaction sites exposes an additional layer of disturbances caused by mutations found in patients’ tumors.
b. Bar graph depicting the number of heptameric peptide regions (HPR’s) in PhosphoAtlas that contain COSMIC-defined synonymous and non-synonymous variants, or no mutation at all. The number of unique (kinase–HPR–substrate) entries affected by cancer mutations is shown on top.
c. Total number of cancer-associated, non-synonymous heptameric peptide region variants (nsHPRv) derived from COSMIC-mining analysis. The number of potential additional cancer-related predicted PPI entries is indicated on top.
d. Distribution of the protein-coding consequences of genetic mutations on phosphorylatable HPR’s.
e. Distribution of co-occurrence of non-synonymous versus synonymous variants across all amino acid found across all HPRs.
f. Spectrum of malignancies most prone to include mutations affecting phosphorylation circuits.
g. Spectrum of proteins affected by mutations that alter their phosphorylatable target regions. All substrate proteins from PhosphoAtlas are distributed by the mean number of total variants per HPR versus the number of known HPR per given substrate. Each protein is color-coded by the mean percentage of non-synonymous variants per total number of variants in a given substrate (reference color scale 0–100%). The bottom panel contains substrates for which no variants in their HPR’s have been reported.
h. Proteins with the most recurrently mutable peptide sites across all human tumors. The top 50 HPR’s with the highest proportion of non-synonymous variants to total number of variants per HPR were first identified, then the corresponding proteins were selected, and finally all HPR’s from each of these substrates were plotted. Proteins are sorted alphabetically on the x-axis. Each HPR is shown as a triangle and color-coded by the mean percentage of non-synonymous variants out of total reported non-synonymous and synonymous variants per HPR (color scale in (g)).

