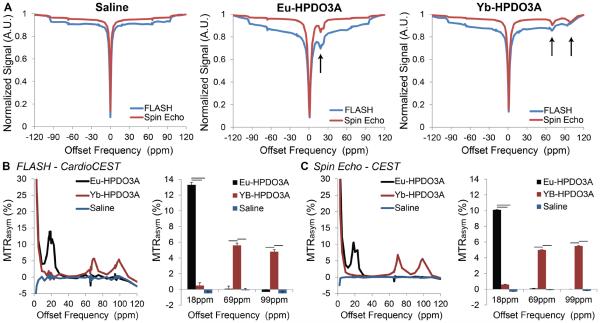
Figure 2.
Phantom validation experiments. (A) Z spectra acquired using conventional spin-echo CEST imaging (red) and FLASH–cardioCEST imaging (blue) in phantoms containing either saline (left), 20 mM Eu-HPDO3A (middle), or 20 mM Yb-HPDO3A (right). Saturation module parameters and the duration of readout following saturation were identical for both methods. Asymmetry in Z spectra reflecting CEST contrast in phantoms containing Eu-HPDO3A or Yb-HPDO3A is highlighted by black arrows. Slight deviations near the resonant frequencies of Eu/Yb-HPDO3A in non-corresponding phantoms likely result from increased sampling density about those frequencies. (B, C) MTRasym data from spectra acquired using FLASH–cardioCEST (B) and spin-echo CEST (C) methods revealed similar unique peaks for Eu-HPDO3A and Yb-HPDO3A, with no CEST contrast in saline phantoms. Data in bar graphs is represented as mean + standard deviation; black bars indicate p<0.05.

