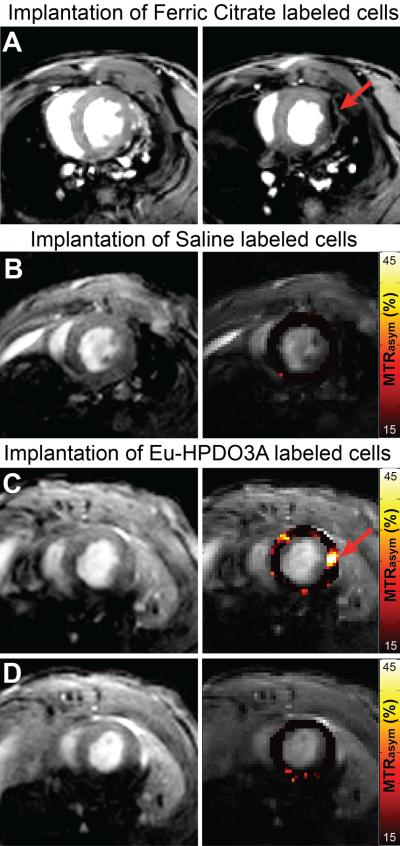
Figure 4.
In vivo cardioCEST tracking of Eu-HPDO3A-labeled cells. (A) End-diastolic images acquired following the intramyocardial implantation of ferric-citrate-labeled (see supplemental data) C2C12 cells are shown for reference purposes. In comparison with a mid-ventricular slice without labeled cells (left), the adjacent slice containing labeled cells (right) demonstrates severe signal loss (red arrow) at the location of labeled cells along the lateral wall of the left ventricle. (B) Magnitude (left) and superimposed left ventricular MTRasym maps (right) generated using cardioCEST reveal uniformly low MTRasym patterns in a mouse receiving saline-labeled cells. (C) In a mouse receiving cells labeled with Eu-HPDO3A, the location of transplanted cells (red arrow) demonstrates significantly elevated MTRasym values. The location of labeled cells was confirmed using ex vivo histological staining (see Supplementary Figure 1). (D) Similar mapping of MTRasym in an adjacent slice 2 mm towards the apex reveals the absence of Eu-HPDO3A-labeled cells. All MTRasym maps are displayed using a threshold of MTRasym >15%.

