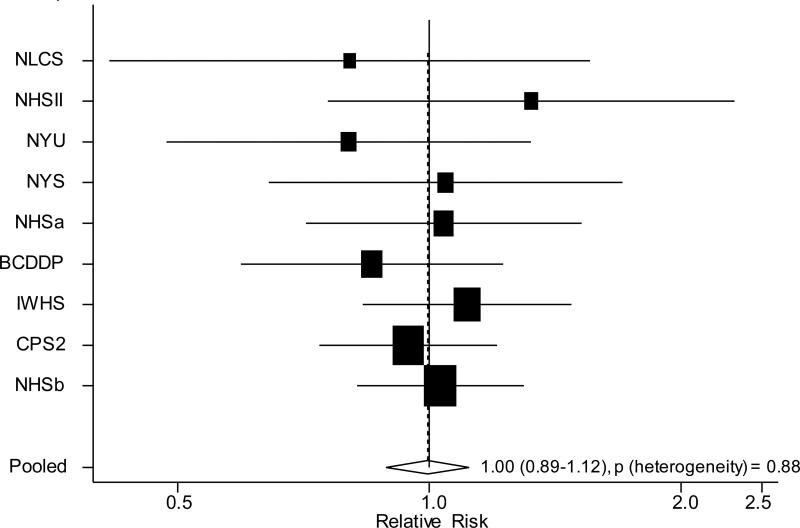
Figure 1.
Study-specific and pooled multivariate RRs and 95% CI of ovarian cancer comparing multivitamin users to nonusers1,2
1 BCDDP=Breast Cancer Detection Demonstration Project Follow-up Cohort, CPS II=Cancer Prevention Study II Nutrition Cohort, IWHS=Iowa Women's Health Study, NLCS =Netherland Cohort Study, NYSC = New York State Cohort, NYUWHS=New York University Women's Health Study, NHSa=Nurses’ Health Study (a), NHSb=Nurses’ Health Study (b), NHS II=Nurses’ Health Study II
2 The black squares and horizontal lines correspond to the study-specific multivariate RR and 95% CI, respectively. The area of the black square reflects the study-specific weight (inverse of the variance). The diamond represents the pooled multivariate RR and 95% CI. The solid vertical line indicates a RR of 1.0. The Canadian National Breast Screening Study and Swedish Mammography Cohort were not included in this analysis because data on multivitamin use was not available in these studies at baseline.

