
Figure 1.
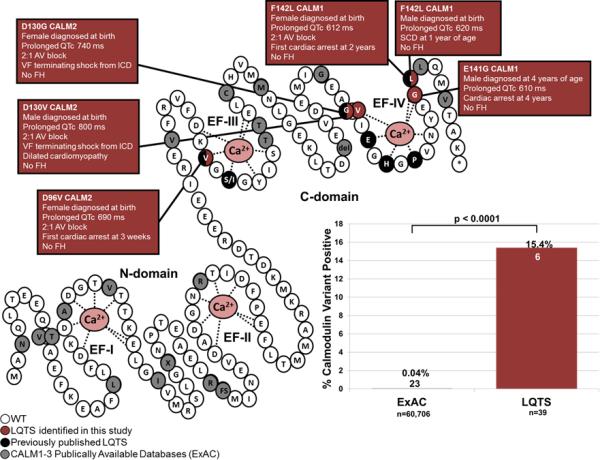
CaM variants identified in individuals with LQTS and the publically available databases. On the right is a schematic rendering of the CaM protein highlighting the N-domain and C-domain, each containing two EF hands (labeled EF-I through EF-IV) with Ca2+ (pink) bound. White circles represent the WT residues, red circles represent the variant residues found in our LQTS cohort, black circles represented previously published CaM variants in LQTS, grey circles represent variant residues found in all three CaM proteins in ExAC. The bar graph on the left compares the frequency of variant positive individuals in the ExAC (23/60,706; 0.04%) to our LQTS cohort (6/39; 15.4%; p<0.0001).