
Figure 2.
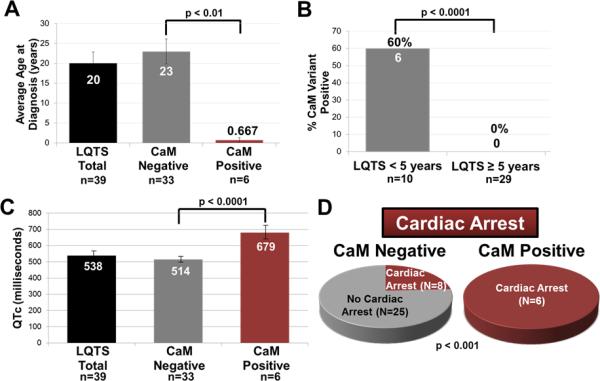
Demographic and clinical characteristics of the CaM-positive patients. (A) Bar graph comparing average age of diagnosis for our CaM-negative cases (23 ± 3 years), and CaM-positive cases (0.67 ± 0.7 years; p < 0.01). (B) Bar graph comparing the percent CaM-positive patients < 5 years of age (6/10; 60%) to patients ≥ 5 years of age (0/29; 0%; p < 0.0001). (C) Bar graph comparing the QTc of CaM negative patients (514 ± 9 ms) to CaM-positive patients (679 ± 32 ms; p < 0.0001). (D) Pie charts comparing the number of patients who had experienced cardiac arrest in our CaM-negative (8/33; 24%) versus CaM-positive patients (6/6; 100%; p < 0.001). Data in (A) and (B) are shown as mean ± SEM.