
Figure 3.
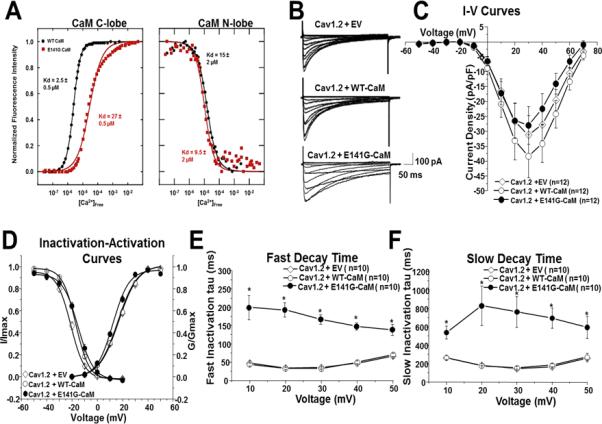
Ca2+ titration curves for WT- and E141G-CaM and patch clamp analysis in TSA201 cells. (A) Data were used to derive dissociation constants (Kd, in μM) for the each domain. E141G-CaM led to an 11-fold reduction in Ca2+ affinity of CaM C-domain compared to WT-CaM, whereas N-domain Ca2+ binding was not statistically different. Values are averages of 3 experiments, and error was determined by analysis of the curve fits. (B) Representative tracings of whole cell CaV1.2 current from TSA201 cells expressing CaV1.2+EV, CaV1.2+WT-CaM and CaV1.2+E141G-CaM determined from a holding potential −90 mV to testing potential of +70 mV in 10 mV increments with 500 ms duration. (C) Current-voltage relationship for CaV1.2+EV, CaV1.2+WT-CaM, and CaV1.2+E141G-CaM. All values represent mean ± SEM. (D) Inactivation-activation curves of CaV1.2+EV, CaV1.2+WT-CaM and CaV1.2+E141G-CaM (n=8-12). Steady-state inactivation was determined from a holding potential of −90 mV to pre-pulse of 20 mV in 10 mV increments with 10 s duration followed by a test pulse of 30 mV with 500 ms duration. I/Imax represents normalized calcium current and G/Gmax represents normalized conductance. Fast (E) and slow (F) decay time of CaV1.2+EV, CaV1.2+WT-CaM and CaV1.2+E141G-CaM. *P<0.05 vs. CaV1.2+WT-CaM.