
Figure 5.
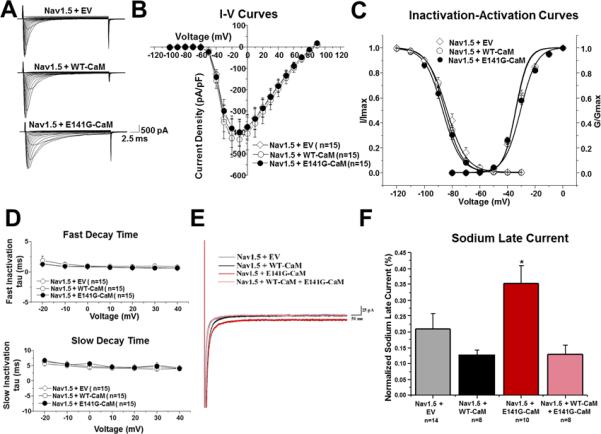
E141G-CaM leads to increased NaV1.5 late current. (A) Representative tracings of whole cell NaV1.5 current from TSA201 cells expressing NaV1.5+EV, NaV1.5+WT-CaM, and NaV1.5+E141G-CaM determined from a holding potential of −100 mV to testing potential of +90 mV in 10 mV increments with 24 ms duration. (B) Current-voltage relationship for NaV1.5+EV, NaV1.5+WT-CaM, and NaV1.5+E141G-CaM. All values represent mean ± SEM. (C) Inactivation-activation curves of NaV1.5+EV, NaV1.5+WT-CaM and NaV1.5+E141G-CaM (n=13-15). Steady-state inactivation obtained from a holding potential of −120 mV to pre-pulse of 0 mV in 10 mV increments with 976 ms duration followed by a test pulse of 0 mV with 24 ms duration. I/Imax represents normalized sodium current, G/Gmax represents normalized conductance. (D) Fast and slow decay time of NaV1.5+EV, NaV1.5+WT-CaM, and NaV1.5+E141G-CaM. (E) Representative tracings of NaV1.5 late current from NaV1.5+EV, NaV1.5+WT-CaM, NaV1.5+E141G-CaM, and NaV1.5+WT-CaM+E141G-CaM determined from a holding potential of −120 mV to −20 mV with 700ms duration. (F) Group data showing NaV1.5 late current normalized to peak (%) for NaV1.5+EV, NaV1.5+WT-CaM, NaV1.5+E141G-CaM, and NaV1.5+WT-CaM+E141G-CaM. *P<0.05 vs. NaV1.5+WT-CaM.