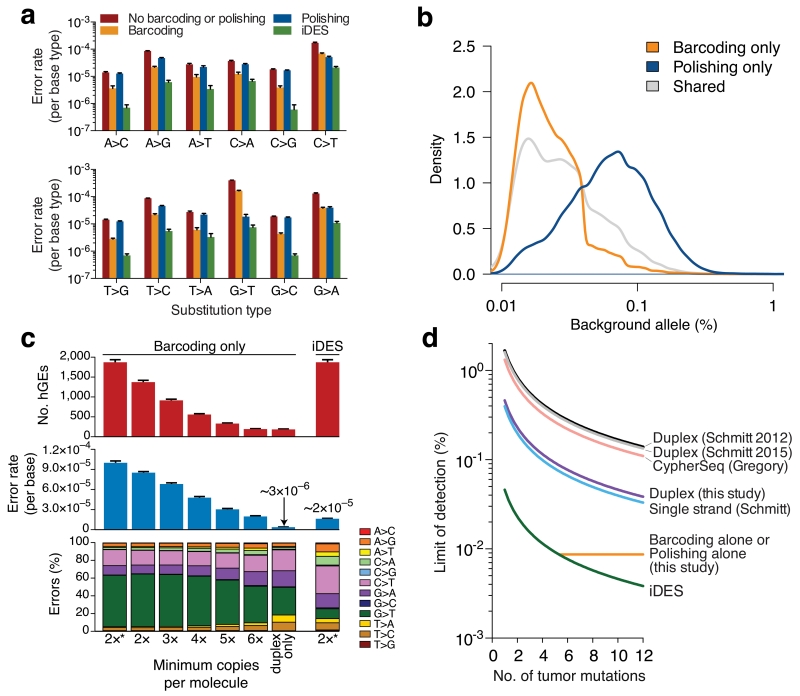
Figure 3. Technical performance of iDES.
(a) Impact of alternative error suppression methods on nucleotide substitution classes. Error rates were calculated with respect to each of the four reference bases separately (Methods). (b) Distribution of background alleles uniquely eliminated by barcoding or polishing alone in healthy control cfDNA. (c) Comparison of iDES with various barcoding strategies for selector-wide error profiles and recovered hGEs. The barcoding strategy denoted by ‘2*’ maximizes the retention of sequenced molecules and is the approach used in this work (Methods). Data are presented as means +/− s.e.m. (d) Analytical modeling of detection limits for various error suppression methods12,14,17 as a function of available tumor-derived mutations (90% confidence detection limit; Methods). Sequencing throughput was calibrated to iDES, such that the quantity of reads needed to recover 5,000 hGEs was determined and then used to estimate the number of recovered hGEs for all other methods given their reported efficiencies (Supplementary Fig. 8a). The theoretically maximum detection-limit of a given method, shown as a horizontal line, is bound by the method’s error rate. For additional details, see Supplementary Figure 8. The same 12 normal control samples shown in Fig. 2b were used for the analyses in a–c.

