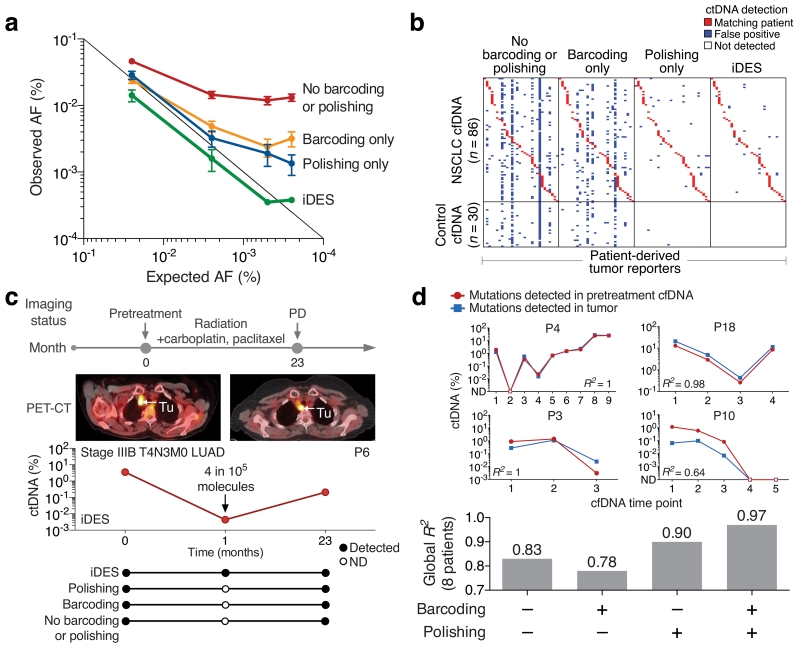
Figure 5. Ultrasensitive ctDNA detection and monitoring with iDES-enhanced CAPP-Seq.
(a) Analysis of ctDNA detection limits using a hypermutated glioblastoma (GBM) tumor mixed into normal control cfDNA in defined proportions. Here, 30 mutations were randomly selected from a pool of 1,502 total mutations known to be present in the GBM tumor and covered by the sequencing panel. Random sampling of 30 mutations was repeated 50 times and the results are presented as means +/− 95% confidence intervals. For further details, see Supplementary Fig. 12 and Methods. AF, allele fraction. (b) Comparison of error-suppression methods for the detection of ctDNA in pre- and post-treatment plasma from 30 NSCLC patients. Patient-derived somatic variants (columns; n=30 sets) were assessed in every plasma sample (rows; n=116), including 30 normal controls to evaluate specificity. The same samples were analyzed for each method (e.g., iDES) and are identically ordered in the heat map. Red squares denote a genetically matched sample (i.e., patient-derived tumor mutations were significantly detectable in a plasma sample from the same patient). Additional details are provided in Supplementary Fig. 13. (c) Using iDES, but not other methods, ctDNA was detectable prior to clinical progression in a stage IIIB NSCLC patient. (d) Top: Analysis of variants called from tumor biopsies versus variants called directly from pretreatment cfDNA with iDES-enhanced CAPP-Seq. Estimated ctDNA levels were compared by linear regression. Open circles/squares indicate time points without significantly detectable ctDNA. ND, not detected. Time points are shown in chronological order (1, pretreatment; >1, post-treatment). Bottom: Comparison of error suppression methods for the same analysis shown above but across all 8 evaluable patients (Methods). Linear regression was applied globally across all 37 plasma time points profiled for these eight patients.

