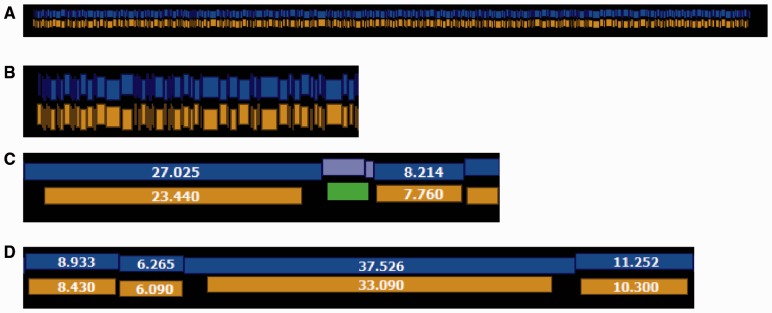
Fig. 3.
Comparison of E.coli K12 experimental optical map with reference. (A) Overall, the consensus optical map (gold) assembled from experimental molecular maps shows great concordance with the in silico digest of the reference sequence (blue). (B) A close view of the left end of the same alignment shown in A. (C) An example of a matched chunk containing two fragments in reference (light blue) aligned to one fragment in the optical map (green). This indicates that a small restriction fragment is missing from the optical map. (D) Illustration of the overall undersizing bias of the optical map. Fragment sizes are given in kilobases (Color version of this figure is available at Bioinformatics online.)

