Fig. 2.

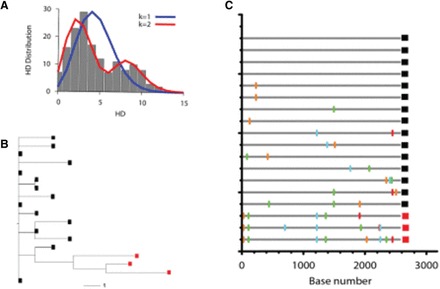
Comparison of SPMM and a maximum likelihood tree model. (A) The pairwise HD distribution of the envelope sequences sampled from subject CAP8 in reference (Abrahams et al., 2009) is represented by gray boxes. The fit of the SPMM with one founder variant (blue line) is compared with that of two founder variants (red line). (B) The maximum likelihood tree for subject CAP8. Two lineages classified by the SPMM are separately marked by black and red squares. (C) The highlighter plot of the envelope sequences of subject CAP8. The three HIV envelope sequences marked in red are classified as a separate lineage by the SPMM from the 15 sequences marked in black
