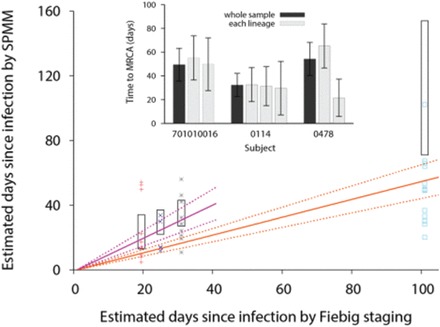
Fig. 3.

Comparison between SPMM estimates of infection duration and Fiebig staging and comparison of time to MRCA among different lineages. Our estimates of the duration of infections by the SPMM are compared with estimated times post infection by Fiebig staging for 37 acutely infected individuals whose infections originated from multiple founder viruses. The Fiebig stages I/II, III, IV, and V were colored as red, blue, gray, and sky blue, respectively. Here Fiebig stages I and II are grouped together because subjects in reference (Abrahams et al., 2009) were staged as I or II. The average estimated time post infection for each Fiebig stage was taken from references (Fiebig et al., 2003; Keele et al., 2008; Lee et al., 2009) and the stage I/II value is presented by averaging over the two stages. The 95% confidence interval for days post infection for each Fiebig stage is presented by the black box. The orange solid line with the slope of 0.55 shows a linear relationship between the Fiebig staging and SPMM estimate and the correlation is statistically significant (Spearman’s r = 0.54, P = 0.00059). The 95% confidence intervals of the fit are presented by orange dotted lines. Excluding patients’ samples at Fiebig stage V, the two estimates show a weaker correlation (Spearman r = 0.27, P = 0.20) but the SPMM estimates become more comparable to the Fiebig staging, with a linear regression slope of 1.02 (purple lines). Inset Time to the MRCA of a whole sequence sample (black bar) is compared with that of each mutant lineage (gray bar) from three HIV-1 infected subjects. The 95% CIs are presented as black line
