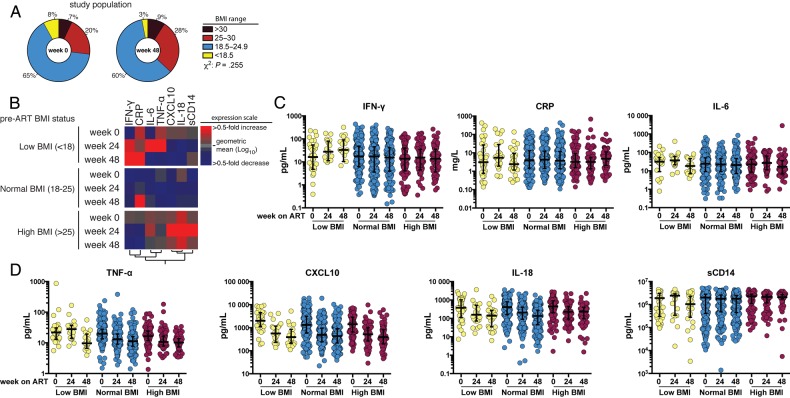
Figure 1.
Body mass index (BMI; calculated as the weight in kilograms divided by the height in meters squared) distributions and effects of baseline BMI on markers of inflammation and immune activation following antiretroviral (ART) initiation. A, Distribution of the study population according to indicated BMI status at weeks 0 and 48 after ART initiation. B, Heat map depicts the overall pattern of expression of markers of inflammation/immune activation. Participants are grouped in rows by baseline BMI, and differences in markers (columns) are seen across rows. Expression scale for each marker represents log10 fold-change from the geometric mean of the entire study population at each time point, with red hues indicating an increase and blue hues indicating a decrease. C and D, Scatterplots of the markers show the overall trend of variation in concentrations of each marker at weeks 0, 24, and 48 following ART initiation, separated by baseline BMI. The lines represent median values and interquartile ranges. Abbreviations: CRP, C-reactive protein; CXCL-10, interferon γ–inducible protein 10; IFN-γ, interferon γ; IL-6, interleukin 6; IL-18, interleukin 18; sCD14, soluble CD14; TNF-α, tumor necrosis factor α.

