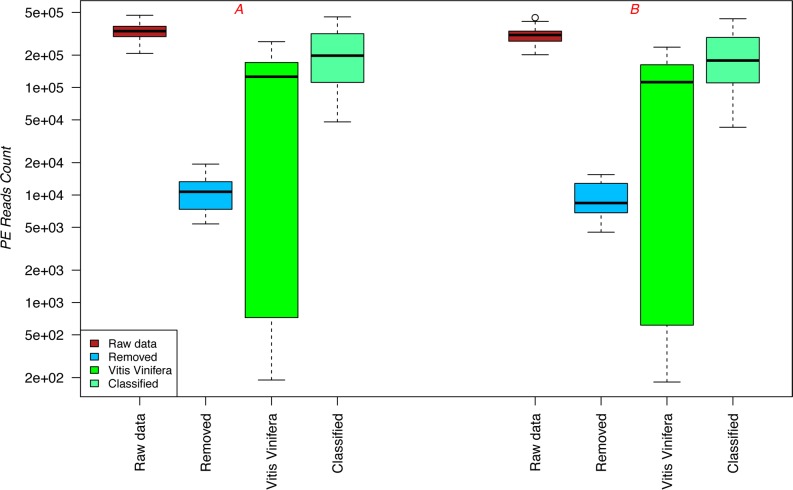
Fig 1. Graphical summary of the results obtained by applying the BioMaS pipeline.
Box plot showing the number of PE reads that were produced by the MiSeq platform for both sequencing runs (raw data), including low quality reads removed after denoising, host reads mapped to Vitis vinifera, and bacterial reads taxonomically classified by BioMaS.

