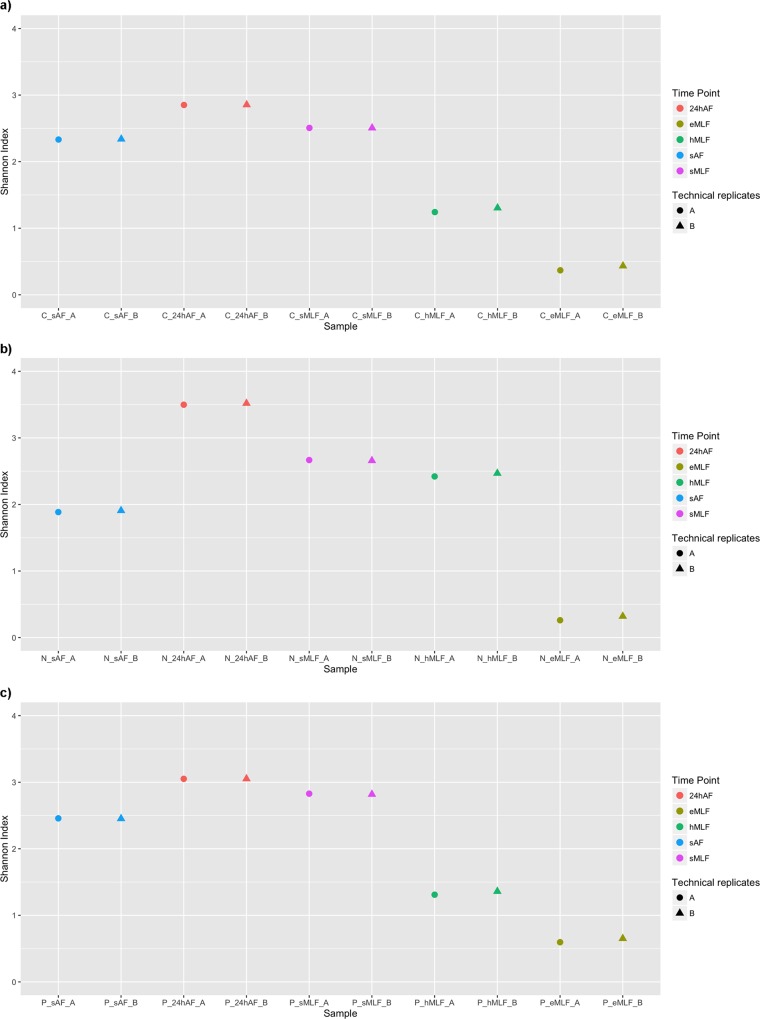
Fig 2. Scatter plot of the calculated Shannon index values.
Shannon index values calculated based on the OTU matrix, obtained from the Illumina MiSeq raw data, are shown for all the tested wine varieties. Only the OTUs that were taxonomically labelled as bacterial or not mapped to Vitis Vinifera plastids were considered. The values calculated for each sample are plotted for Cabernet (a), Negramaro (b), and Primitivo (c). Different colours and shapes were used to distinguish the five time points (sAF, 24hAF, sMLF, hMLF, and eMLF) and the technical replicates (sequencing runs A and B), respectively.

