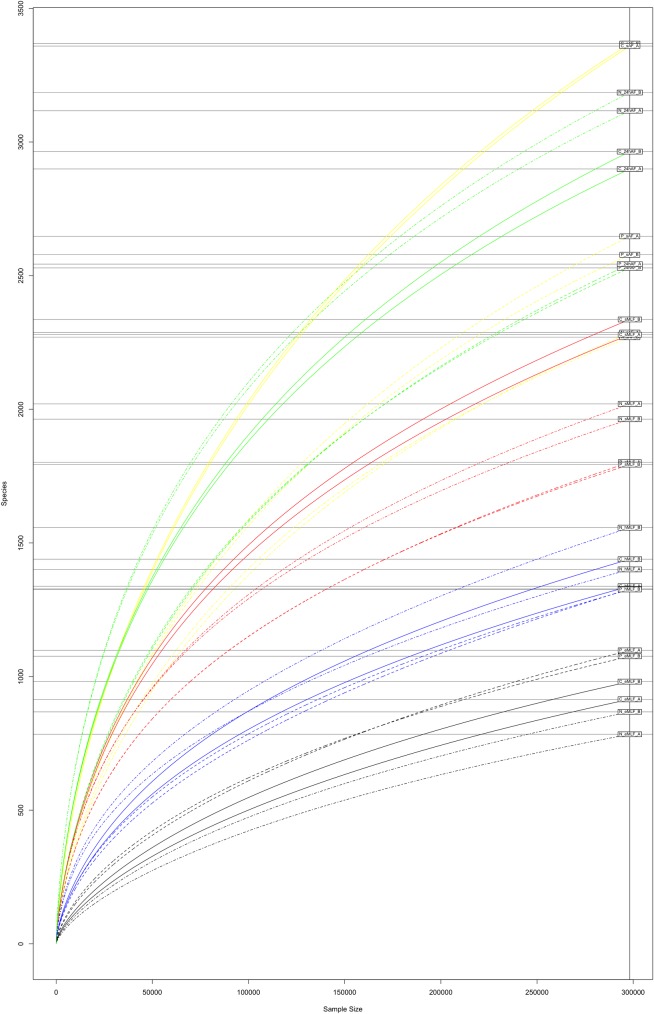
Fig 3. Rarefaction curves for the tested samples.
Rarefaction curves calculated using the OTU matrix obtained from the Illumina MiSeq raw data by using QIIME are shown for all the analysed samples and sequencing runs. The five time points are shown in different colours: sAF (yellow), 24hAF (green), sMLF (red), hMLF (blue), and eMLF (black), and the wine varieties Cabernet, Negramaro, and Primitivo are shown as solid, dot-dash, and dashed lines, respectively.

