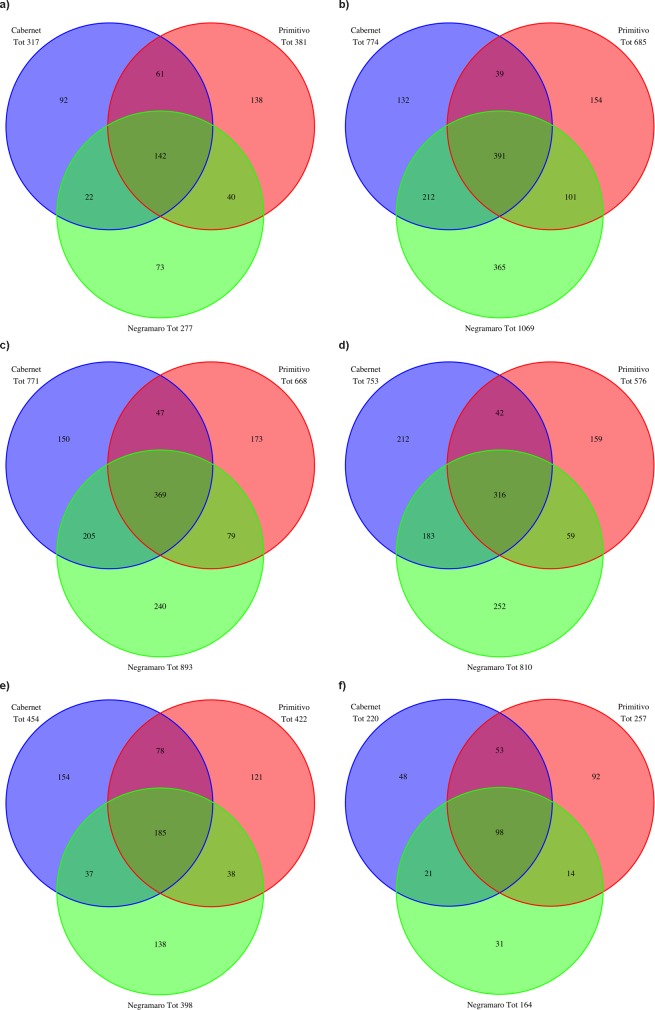
Fig 4. Venn diagrams showing the number of common and unique species detected in the tested wine varieties.
Venn diagrams showing the number of species detected in the three analysed wines (Cabernet, Negramaro, and Primitivo) at each time point: sAF (a), 24hAF (b), sMLF (c), hMLF (d), and eMLF (e). (f) Venn diagram showing the number of species detected in samples from the three wines throughout fermentation (from sAF to eMLF).

