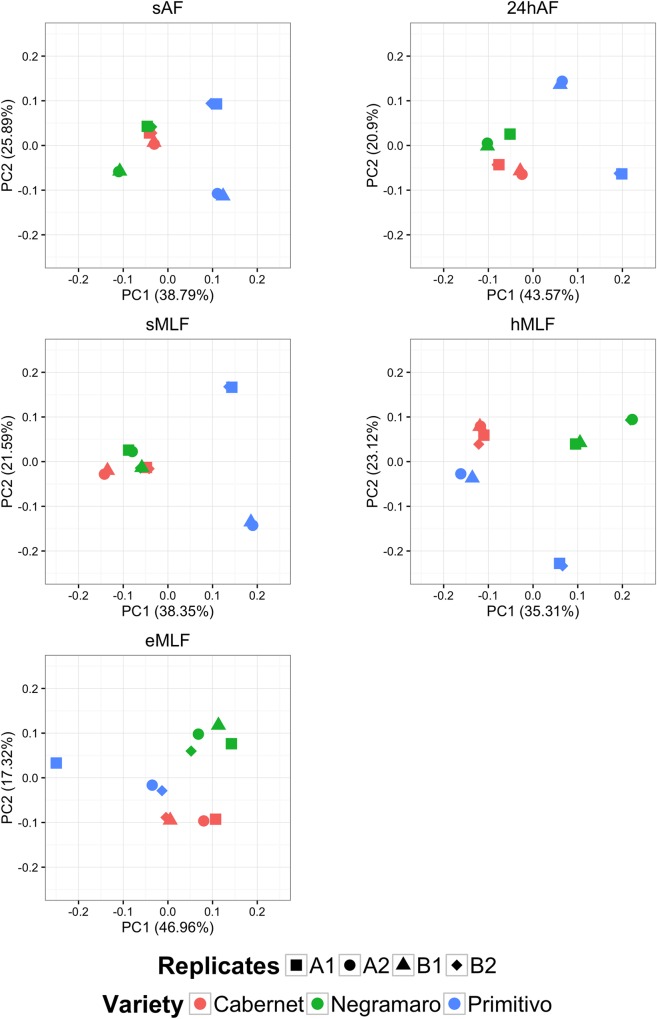
Fig 6. Principal coordinate analysis plots generated at the genus level for the five fermentation time points.
Principal coordinate analysis (PCoA) plots based on the taxonomical classification at the genus level are shown for the five tested time points: sAF, 24hAF, sMLF, hMLF, and eMLF. Biological replicates (1 and 2) and sequencing runs (A and B) of the three analysed wines (Cabernet, Negramaro and Primitivo) are all shown in each plot as different shapes.

