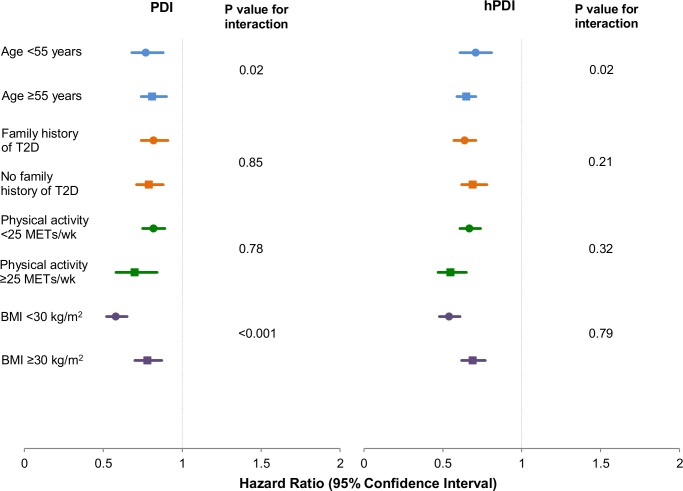
Fig 2. Pooled hazard ratios (95% CI) for type 2 diabetes comparing extreme deciles of the plant-based diet indices, stratified by selected characteristics.
Results were pooled across the three cohorts using a fixed-effects model. Adjusted for age (years), smoking status (never, past, current [1–14, 15–24, or ≥25 cigarettes/day]), physical activity (<3, 3–8.9, 9–17.9, 18–26.9, or ≥27 MET-h/wk), alcohol intake (0, 0.1–4.9, 5–9.9, 10–14.9, or ≥15 g/d), multivitamin use (yes or no), family history of diabetes (yes or no), margarine intake (quintiles), energy intake (quintiles), baseline hypertension (yes or no), baseline hypercholesterolemia (yes or no), and BMI (<21, 21–22.9, 23–24.9, 25–26.9, 27–29.9, 30–32.9, 33–34.9, 35–39.9, or ≥40 kg/m2). Also adjusted for menopause status and postmenopausal hormone use in NHS and NHS2 (premenopausal or, if postmenopausal, current, past, or never postmenopausal hormone use) and for oral contraceptive use in NHS2 (never, past, or current use). p trend < 0.001 for both indices across all strata. p-Value obtained by assigning the median value to each decile and entering this as a continuous variable in the model.

