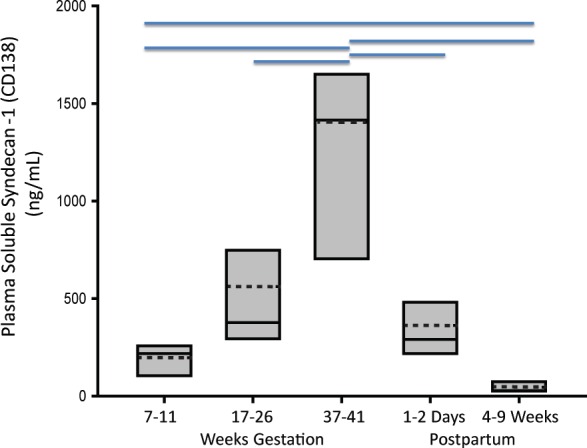
Fig 1. Soluble Sdc1 concentrations increased significantly with advancing gestation.

Box-plot of soluble Sdc1 concentrations in maternal plasma as a function of successive gestational weeks (W) and postpartum stages, of n = 8 women with uncomplicated pregnancy outcome. The solid and dotted lines through the interior of the boxes correspond to median and mean values, respectively. The top and bottom of each box correspond to 75th and 25th percentiles, respectively. Horizontal lines on the top of the graph indicate significant differences between the time points (P<0.05; Repeated Measures Analysis of Variance on Ranks with post hoc Student-Newman-Keuls test).
