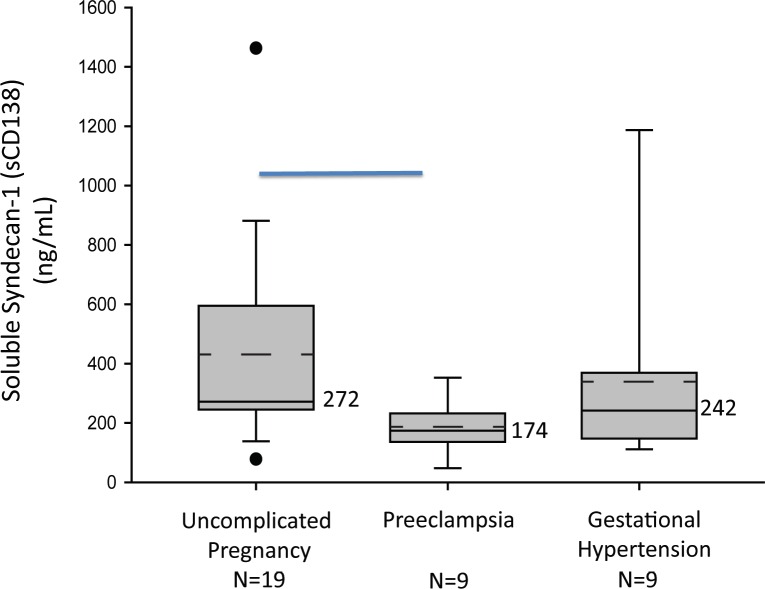
Fig 2. Plasma soluble Sdc1 is reduced at 20 weeks gestation in women who later develop preeclampsia.
Box-plot of soluble Sdc1 concentrations in mid-pregnancy maternal plasma by pregnancy outcome group. The solid line through the interior of each box and the accompanying numerical value corresponds to the group median. The dotted line through the interior of each box denotes arithmetic mean. The top and bottom of each box correspond to 75th and 25th percentiles, respectively. The whiskers (t bars) on the bottom denote the 10th percentile, and those on the top the 90th percentile. Solid circles represent outlier values. The horizontal line, on the top of the graph indicate significant difference between control and preeclampsia groups (P<0.05; Kruskal-Wallis with Dunn’s Post-hoc test).

