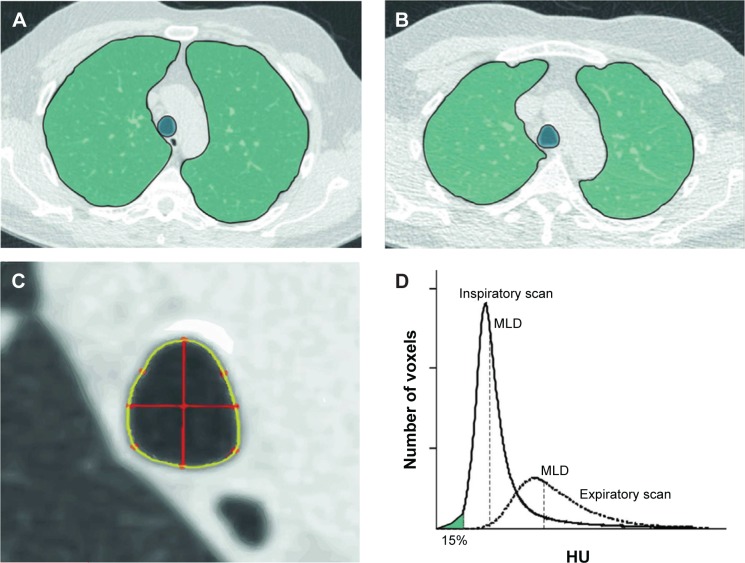
Figure 1.
Illustration of the lung segmentation process and calculation of emphysema, air trapping, and TI.
Notes: (A) Axial inspiratory CT image. (B) Axial expiratory CT image. Both (A and B) show lung segmentation (outlined green area) of the right and left lung on an axial slice. The trachea was segmented as well. (C) Magnified image of the trachea as shown in (A). TI is computed as follows. First, the centroid of the trachea is computed. Then, two orthogonal axes (0° and 90°) are drawn that cross the centroid (red lines). TI is computed as the ratio of the coronal and sagittal lines. (D) Graph showing attenuation histograms for the inspiratory and expiratory CT. The 15th percentile (measure for emphysema) is calculated as the HU point below which 15% of the voxels are distributed. Air trapping is calculated as the ratio of MLD on the expiratory and inspiratory images.
Abbreviations: CT, computed tomography; HU, Hounsfield Unit; MLD, mean lung density; TI, tracheal index.

