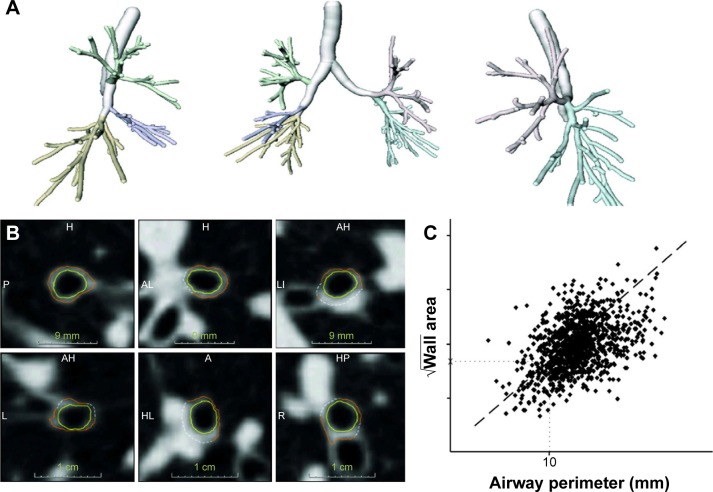
Figure 2.
Illustration of the bronchial segmentation process and the calculation of bronchial wall thickness.
Notes: (A) Bronchial tree segmentation of the right and left lung, separately and combined. (B) Random selection of bronchial cross sections, showing an inner and an outer wall boundary (yellow and orange lines). From these boundaries, the wall area is calculated. (C) Line graph in which the square root of the wall area is plotted against the internal perimeter. A regression line (dashed line) is drawn through the measurements, from which the square root of wall area for a theoretical bronchus with 10 mm lumen perimeter (ie, Pi10) was calculated (dotted lines). Adapted from Mets OM, Schmidt M, Buckens CF, et al. Diagnosis of chronic obstruc tive pulmonary disease in lung cancer screening Computed Tomography scans: independent contribution of emphysema, air trapping and bronchial wall thickening. Respir Res. 2013;14:59.20
Abbreviations: Pi10, airway wall thickness at an internal perimeter of 10 mm; L, left; R, right; P, posterior; A, anterior; H, head; I, inferior.

