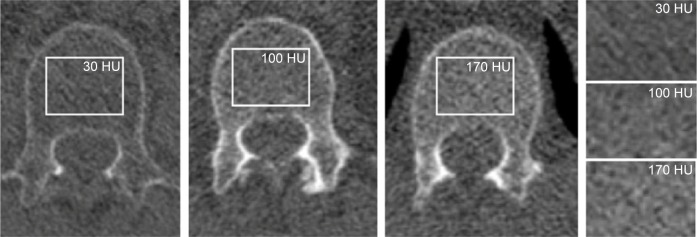
Figure 3.
CT-derived bone density measurements of the spine.
Notes: Regions of interest (rectangular regions) were placed in the trabecular bone between the superior endplate and the middle of the corpus of vertebral body 1 (L1). The three axial images show vertebrae from different participants with different bone densities, viewed in bone window (C=300, W=1,600). The rectangular regions of interest correspond to the regions of interest placed over the vertebrae. From left to right and top to bottom, it shows gradual increase in bone density from 30 HU to 100 and 170 HU, respectively.
Abbreviations: CT, computed tomography; HU, Hounsfield Unit.

