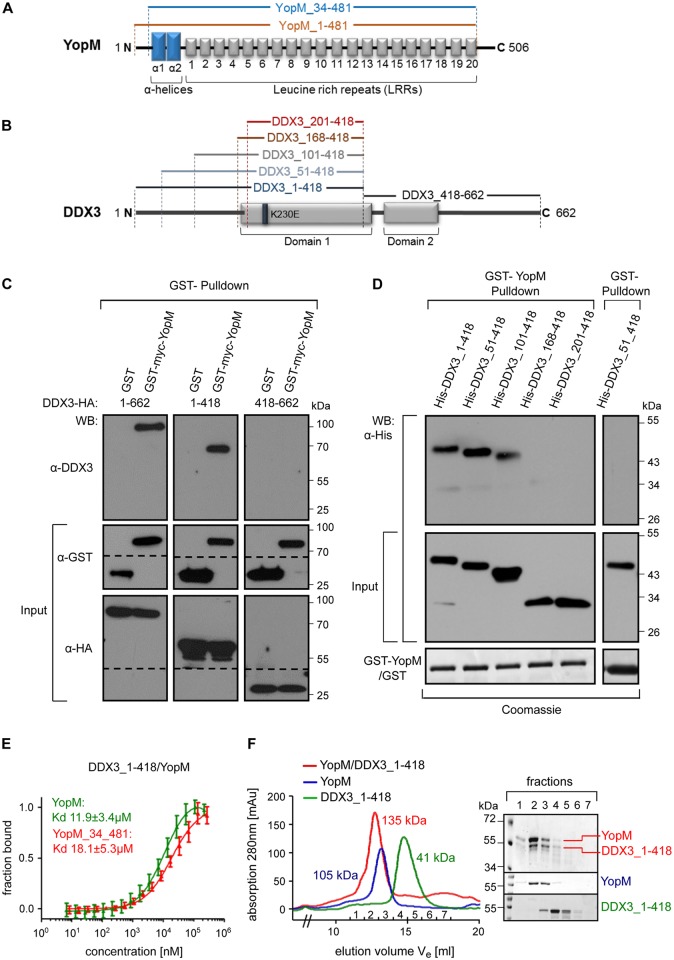
Fig 2. YopM and DDX3 form a 2:1 molecular complex in solution.
A) Schematic representation of YopM from Y. enterocolitica WA314. The N-terminal blue rectangles in the YopM scheme correspond to the two α-helices (α1 and α2). LRRs are represented by numbered boxes. YopM_34–481 represents the crystallized variant of YopM (see below) containing all structured features of the protein. B) Schematic representation of DDX3. The gray rectangles in the DDX3 scheme correspond to the two helicase core domains (1 and 2). Truncated constructs used in GST-pulldown and immunoprecipitation are marked by amino acid numbers and brackets. C) GST-YopM pulldown of transfected DDX3 constructs. GST-Myc-YopM, GST and indicated HA-tagged DDX3 constructs were coexpressed in HEK293T cells and proteins precipitated by glutathione sepharose beads or in input (1/10 volume) were detected by Western blot using indicated antibodies. D) GST-YopM pulldown of bacterially expressed DDX3 constructs. Recombinant GST-YopM or GST bound to glutathione sepharose beads were incubated with bacterial lysates containing indicated His-tagged DDX3 constructs. DDX3 proteins precipitated by GST-YopM or in 1/10 lysate input were detected by Western blot using HisProbe-HRP conjugate. Input of GST or GST-YopM is shown in Coomassie stained gels. E) Microscale thermophoresis determines the binding affinity between YopM and DDX3. Binding strength of DDX3_1–418 to either YopM or YopM_34–481 was quantified by microscale thermophoresis as in Methods. The dissociation constants (Kd) for the respective interactions are indicated (mean +/- SD; one representative experiment out of three similar ones). For microscale thermophoresis experiment determining the binding strength of YopM to either DDX3_1–418 or DDX3_51–418 see also S1A Fig. F) Analytical size exclusion chromatography of the YopM:DDX3 complex. YopM, DDX3_1–418 or a 1:1 (molar ratio) mixture of both proteins were each run on a Superdex 200 gel filtration column. Molecular weights of the peak materials of the three runs (color coded and super-imposed in the figure) were calculated by comparing peak elution fractions with those of standard molecular weight marker proteins (S1B Fig for calibration curves, left panel). Indicated color coded peak fractions were analyzed by SDS PAGE. See also S1C Fig for analytical size exclusion chromatography of the YopM_34–481 and DDX3 1–418 complex. Corresponding calibration curve is shown in S1B Fig (right panel).

