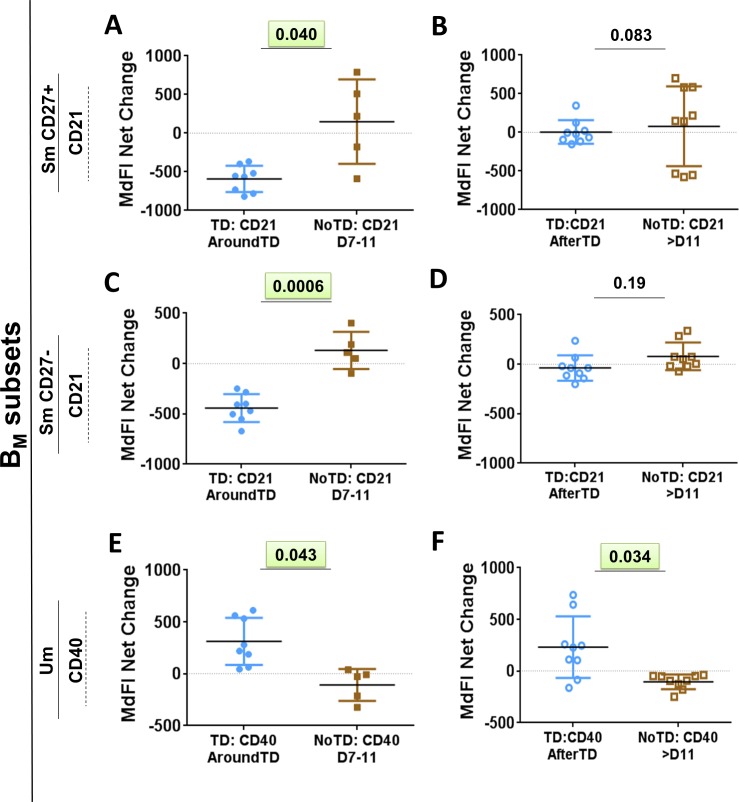
Fig 4. Changes in surface molecules of Sm CD27+, Sm CD27- and Um subsets induced by wt S. Typhi infection.
Shown in panels A, C and E are the expression of CD21 and CD40 from TD (solid blue circles) and NoTD (solid brown squares) volunteers in the AroundTD time frame. Panels B, D and F show the expression of CD21 and CD40 from TD (open blue circles) and NoTD (open brown squares) volunteers in the AfterTD time frame. The P value from the mixed effects model analysis is shown. Significant differences are highlighted in light green. Mean ± SD are presented in all graphs.

