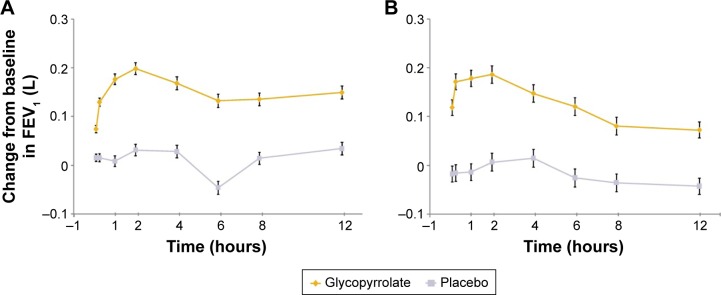
Figure 5.
Serial measurements of FEV1 by timepoint on (A) day 1 and (B) week 12 (FAS).
Notes: Data are LSM (SE); treatment differences: P<0.001 for glycopyrrolate versus placebo at each assessed timepoint.
Abbreviations: FEV1, forced expiratory volume in 1 second; FAS, full analysis set; LSM, least squares mean; SE, standard error.

