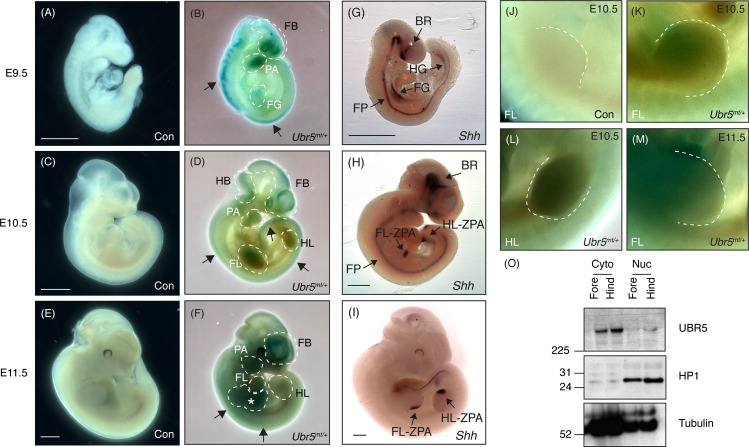
Fig 5. Expression analysis of UBR5MT, Shh and endogenous UBR5.
β-Gal activity was not detected in wild-type controls (Con) embryos (A,C,E), whereas Ubr5mt/+ embryos exhibited staining at (B) E9.5, (D) E10.5 and E11.5 (F). Dashed lines indicate areas of interest. Please see text for more details. (G-I) Shh in situ hybridisation of wild-type control embryos at the indicated embryonic stages. FB = forebrain; HB = hindbrain; PA = pharyngeal arches; FG = foregut; HG = hindgut; FL = forelimb; HL = hindlimb; BR = brain; FP = floorplate; ZPA = zone of polarising activity; an asterisk marks a potential gastrointestinal signal. Scale bars = 1mm. (J-M) Higher magnification images of E10.5 (J-L) and E11.5 (M) limbs of the indicated genotypes. A dashed line outlines the limb bud margins. Representative images shown from n = ≥3 for each stage and genotype. (O) SDS-PAGE and Western blotting of E11.5 fore- and hind-limb lysates for UBR5 expression in cytosolic (Cyto) and nuclear (Nuc) fractions. HP1 (a nuclear marker) and β-tubulin (a predominantly cytosolic marker) were used as loading and fractionation controls. n = 1.

