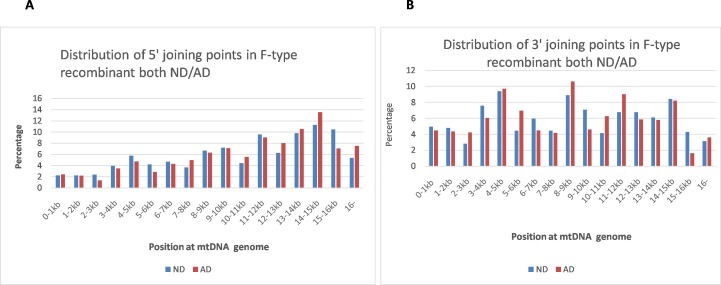
Fig 3. Distribution of 5’and 3’joining points in F-type rearrangement both ND and AD.
A. 5’ joining points in F-type rearrangement: The X-axis represents the nucleotide position along the mitochondrial genome divided into 1kb nucleotide increments, and the Y-axis represents the average F-type rearrangement in aging controls (ND), or patients with Alzheimer’s disease (AD). The percentage of regional rearrangement within each kb is calculated by dividing the average total number of F-type breakpoint fragments within 1kb by the total average F-type fragments in the sample. B. 3’ joining points in F-type rearrangement: The X-axis represents the nucleotide position along the mitochondrial genome divided into 1kb nucleotide increments, and the Y-axis represents the average F-type rearrangement in aging controls (ND), or patients with Alzheimer’s disease (AD). The percentage of regional rearrangement within each kb is calculated by dividing the average total number of 3’ joining point fragments within 1kb by the total average F-type fragments in the sample.

