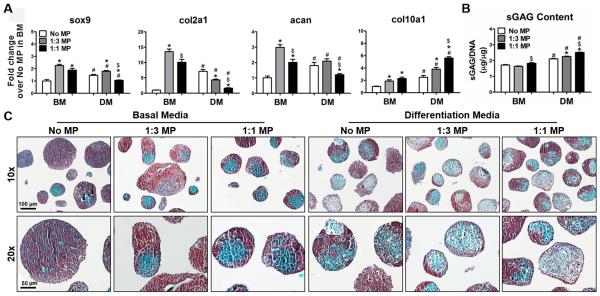
Fig. 2.
Chondrogenesis of ESC aggregates with incorporated MPs. ESC aggregates were cultured for 14 days in either basal media (BM) or differentiation media (DM). (A) Real-time PCR analysis of gene expression of chondrogenic markers. (B) SGAG content extracted from ESC aggregates was quantified by DMMB assay and normalized to DNA content. n=4, *P<0.05 vs. No MP, $P<0.05 vs. 1:3 MP under the same culture condition, #P<0.05 vs. BM. (C) sGAG deposition (red) in aggregates was visualized by safranin O and fast green counterstaining.

