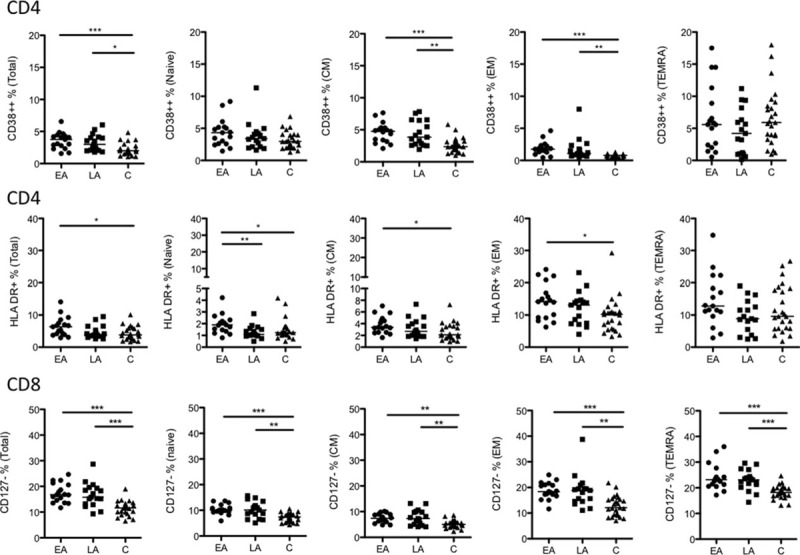
Figure 3.

Frequency of CD38++ CD4+, HLA-DR+ CD4+, and CD127− CD8+ T-cell subsets. The frequency of CD38++ and HLA-DR+ cells among total, naive, CM, EM, and TEMRA CD4+ T cells is shown together with the frequency of CD127− total, naive, CM, EM, and TEMRA CD8+ T cells. The data are presented for the 3 groups studied: EA (n = 17), LA (n = 17), and C (n = 25). The line in the figures represents the median values and the statistics were calculated using ANOVA. ∗P < 0.05, ∗∗P < 0.01, and ∗∗∗P < 0.001. ANOVA, analysis of variance; ART, antiretroviral therapy; CM, central memory; EA, early ART; EM, effector memory; HLA-DR, human leukocyte antigen - antigen D related; LA, late ART; TEMRA, terminally differentiated effector memory cells.
