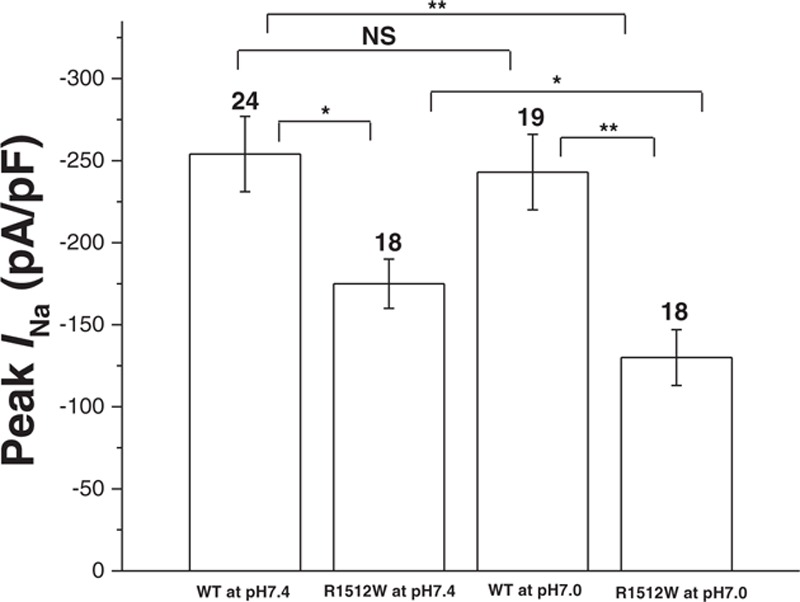
Figure 2.

Summary data for peak sodium current in HEK293 cells. Summary data of peak sodium current densities from each group. The number of tested cells is indicated above the bar. NS, no significant difference. ∗P < 0.05. ∗∗P < 0.005 (one-way analysis of variance followed by a Bonferroni test).
