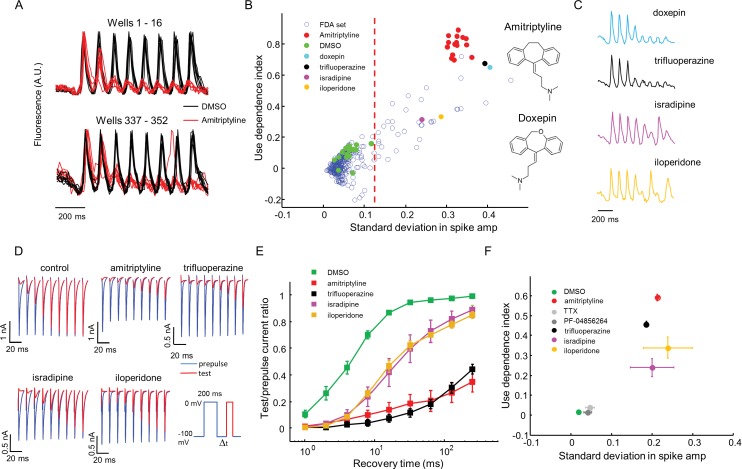
Figure 5. High throughput screening of a FDA-approved drug library in NaV1.7-OS HEK cells.
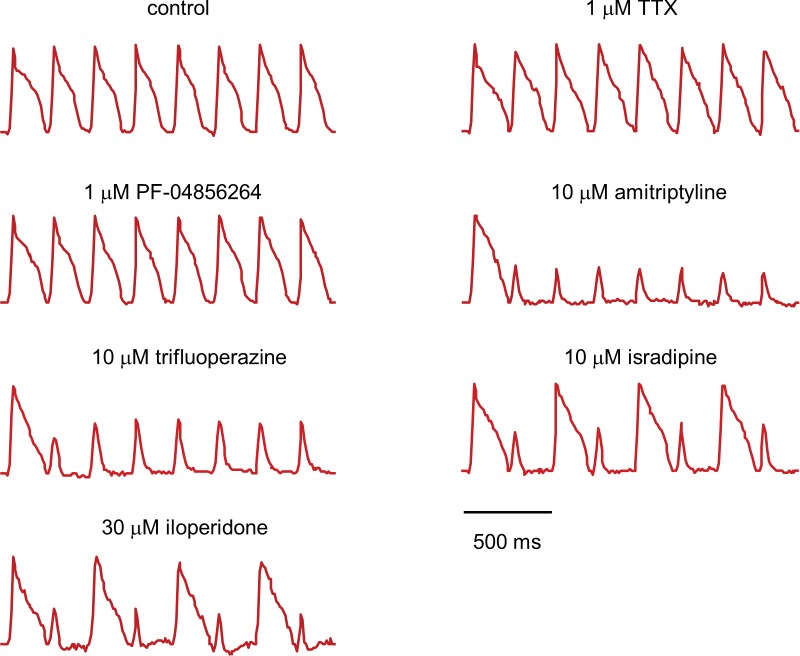
(A) QuasAr2 fluorescence from positive (amitriptyline) and negative (DMSO) control wells. Cells were stimulated with eight pulses of blue light (20 ms, 50 mW/cm2) at 10 Hz, and QuasAr2 fluorescence was monitored with 635 nm excitation, 400 W/cm2. (B) Screen results. The response of each well was parameterized by its use dependence index and standard deviation in spike amplitude. Positive controls (red) and negative controls (green) were well separated. Selected hits were chosen for further analysis. Inset: structures of amitriptyline and doxepin. (C) QuasAr2 fluorescence traces of doxepin, trifluoperazine, isradipine and iloperidone recorded in the screen. (D) Validation of select hits by manual electrophysiology. Nav1.7-Optopatch cells were held at −100 mV. A 200 ms prepulse to 0 mV allowed drug binding. Recovery times at −100 mV ranged from 1 ms to 256 ms. A test pulse to 0 mV, 100 ms duration, probed the degree of channel recovery. Blue: NaV1.7 current during prepulse. Red: NaV1.7 current during test pulse. (Prepulse and test pulse currents have been time-shifted and overlaid for easy comparison). Each compound was tested at 10 μM. (E) Quantification of compound effects on NaV1.7 recovery from inactivation. The plots show ratio of current amplitude at test pulse to prepulse, as a function of recovery period (n = 3 cells for each compound, n = 12 cells for control). (F) Characterization of select hits from (B) in NaV1.5-OS HEK cells. Cells were stimulated with eight pulses of blue light (20 ms, 50 mW/cm2) at 4 Hz. The 4 Hz stimulus was selected because action potential width of Nav1.5-OS cells lasted longer than 200 ms under control conditions. Data analyzed and plotted as in (B) (n = 4–6 wells per drug). Drug concentrations were TTX: 1 μM, PF-04856264: 1 μM, amitriptyline: 10 μM, trifluoperazine: 10 μM, isradipine: 10 μM, iloperidone: 30 μM).
DOI: http://dx.doi.org/10.7554/eLife.15202.012


