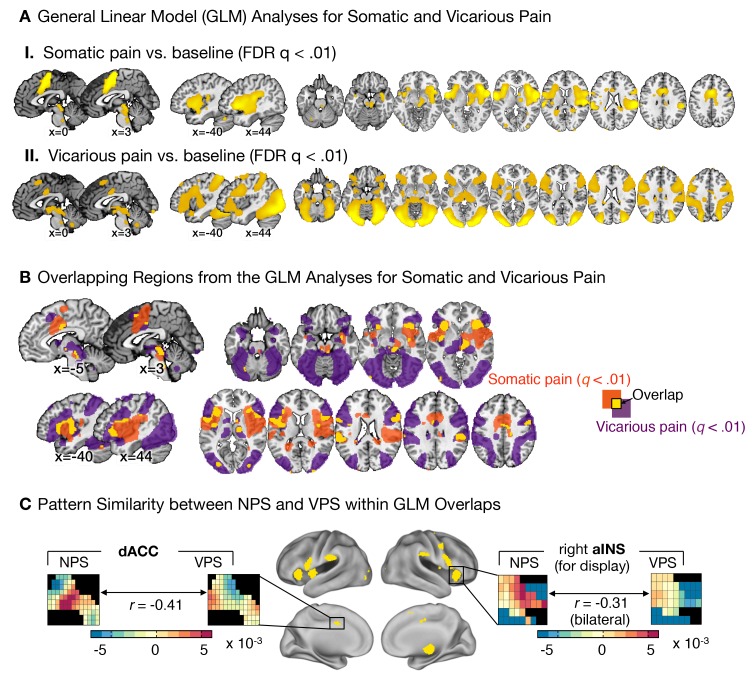
Figure 5. Univariate general linear model analyses and multivariate pattern comparisons.
(A) group level general linear model (GLM) analyses for somatic and vicarious pain. (I.): GLM results for somatic pain against baseline thresholded at FDR q<0.01; (II.): GLM results for vicarious pain against baseline thresholded at FDR q<0.01; (B) General Linear Model (GLM) results for somatic pain (in orange) and vicarious pain (in purple) against baseline, thresholded at FDR q<0.01 with overlap in the statistically significant regions (FDR q<0.01) between somatic and vicarious pain shown in yellow (these overlapping regions were used for further within-participant cross-prediction analyses); (C) Pattern comparison within the anterior insula (aINS) and dorsal anterior cingulate cortex (dACC) for the NPS and VPS (black squares in the pattern mask indicate empty voxels not included for the analysis); correlation values are computed using all overlapping voxels in the dACC and bilateral aINS voxels (only right aINS shown for display).

