(
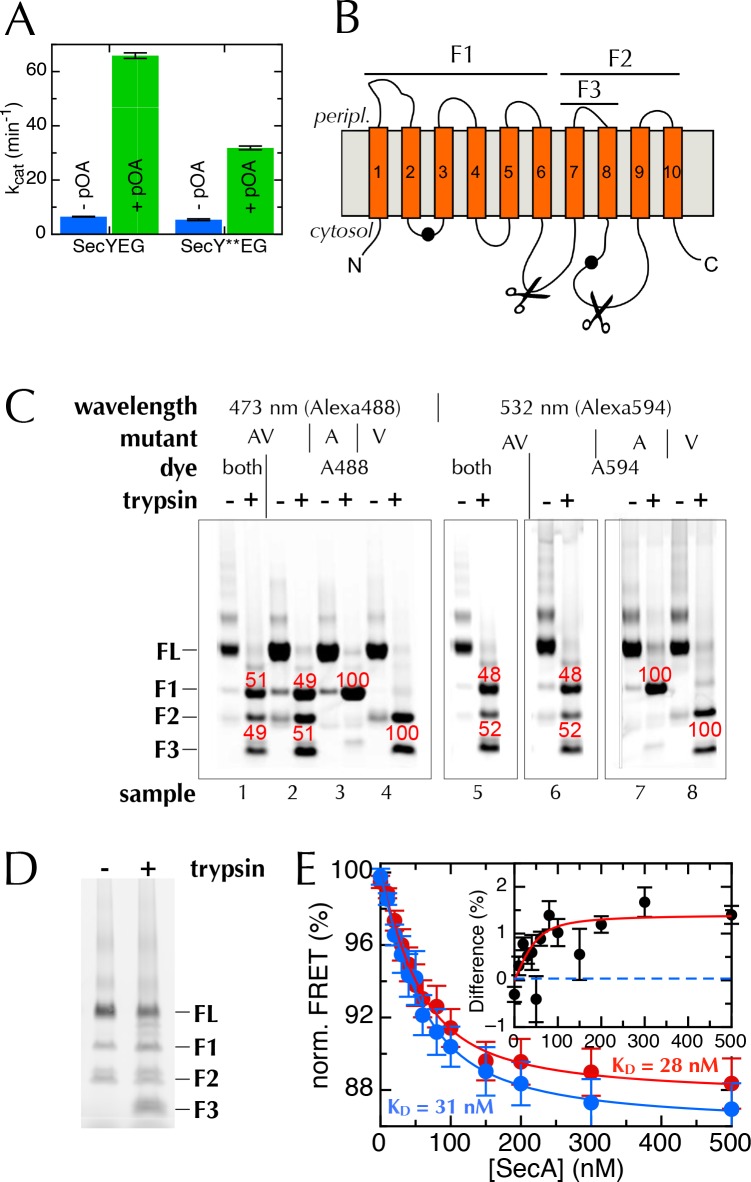
A) ATPase assay on SecA in the presence of saturating amounts of SecYEG or SecY**EG PLs.Rates are shown both before and after addition of pre-protein (pOA) to 0.7 µM, and demonstrate that SecY**EG is active. (
B) Schematic diagram of SecY, with the ten TMs shown, and the two labelling positions (A103 and V353) shown as black circles. The primary and secondary trypsin cleavage sites – between TMs 6–7 and TMs 8–9, respectively – are also marked out. Cleavage with trypsin yields one fragment of ~28 kDa containing the A103 position (F1), and another of ~21 kDa containing the V353 position (F2). F2 is partially cleaved to produce another 10 kDa fragment (F3), which also contains the V353 position. (
C) Fluorescence visualisation of SDS-PAGE following trypsin cleavage of the two single mutants, SecYEG
A103C (A) and SecYEG
V353C (V), and the double mutant (AV) all conducted in DDM. Each pair of lanes shows SecYEG without (-) and with (+) trypsin treatment; in the absence of trypsin, fluorescent protein runs as a full length band (FL), while trypsin cleavage produces fragments F1–F3. Numbers in red show percentages of the total intensity for the bands in the lane. As expected, fluorophores on the A103 (A) position run in band F1 (samples 3 & 7), while fluorophores on V353 (V) are distributed between bands F2 and F3 (samples 4 & 8). Protein labelled with a single dye at both positions (samples 2 and 6) shows both positions labelled equally (samples 2 & 6). The SecY**EG mutant (samples 1 and 5) is labelled equally on both positions, with both dyes. Therefore, we can rule out an unexpected asymmetric dye loading on the two sites that would skew the FRET results. (
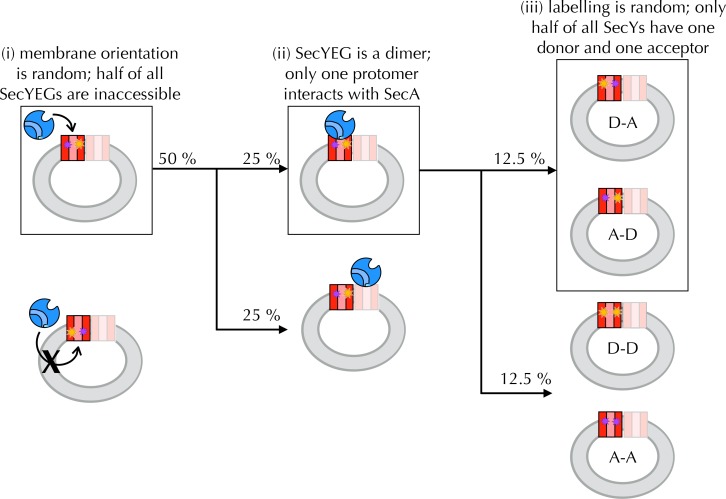
D) Analysis of SecY**EG PLs by trypsin proteolysis, results shown without (-) and with (+) trypsin. Fluorescence quantification indicates that the band corresponding to full-length SecYEG accounts for 54% of the total signal in the '+' lane, once the lower molecular weight bands in the '-' lane are corrected for. This is equivalent to 46% outward facing SecYs: consistent, within error, with previous reports that show equal amounts of inward- and outward-facing SecYEG (
Mao et al., 2013;
Schulze et al., 2014). (
E) Normalised FRET efficiencies of 50 nM SecY**EG in PLs in the presence of 500 µM ADP (red) or 500 µM AMPPNP (blue), as a function of SecA concentration. Data are fitted to a tight binding equation and show a difference in apparent FRET efficiency at saturation, but no measurable difference in affinity. Due to variability in protein preps, labelling efficiencies and reconstitutions, variation in the total magnitude of the signal was greater than the individual differences between ADP and AMPPNP. To account for this, we calculated the differences in FRET pairwise for each data set (inset). Error bars represent the standard error of mean (SEM) of five replicates, and the dotted blue line represents where the data would cluster if the ADP and AMPPNP titrations gave the same signal.


