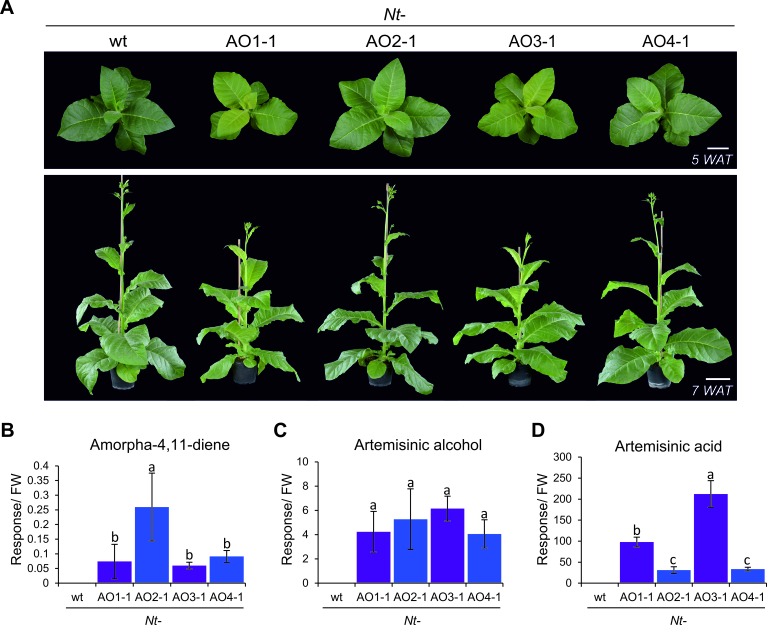
Figure 3. Phenotype of transplastomic tobacco plants and accumulation of artemisinic compounds.
(A) Transplastomic lines Nt-AO1-1 and Nt-AO3-1 display a slightly pale and growth-delayed phenotype at the juvenile stage. WAT: weeks after transfer from tissue culture to soil; scale bars: 10 cm. (B) Amorpha-4,11-diene is synthesized in all transplastomic lines, but accumulates to lower levels in the lines displaying an altered phenotype (purple bars). (C) Artemisinic alcohol is detected in similar amounts in all transplastomic plants. (D) Accumulation of artemisinic acid correlates with the altered phenotype of Nt-AO1-1 and Nt-AO3-1. Relative accumulation of amorpha-4,11-diene was profiled by GC-MS analysis of volatile organic compounds (VOCs). Relative accumulation of the sum of free and conjugated artemisinic alcohol and artemisinic acid were determined by GC-MS analysis of the soluble metabolite fraction after saponification (see Materials and methods; Figures 6 and 7). In agreement with previous reports (van Herpen et al., 2010), these compounds were found to be present mainly as conjugates. Expanding leaves of 5–6 plants per line were used for each measurement. Error bars represent the SD. Different letters above the bars indicate significant differences as determined by One-way ANOVA (p<0.001) and the Holm-Sidak post-hoc test.


