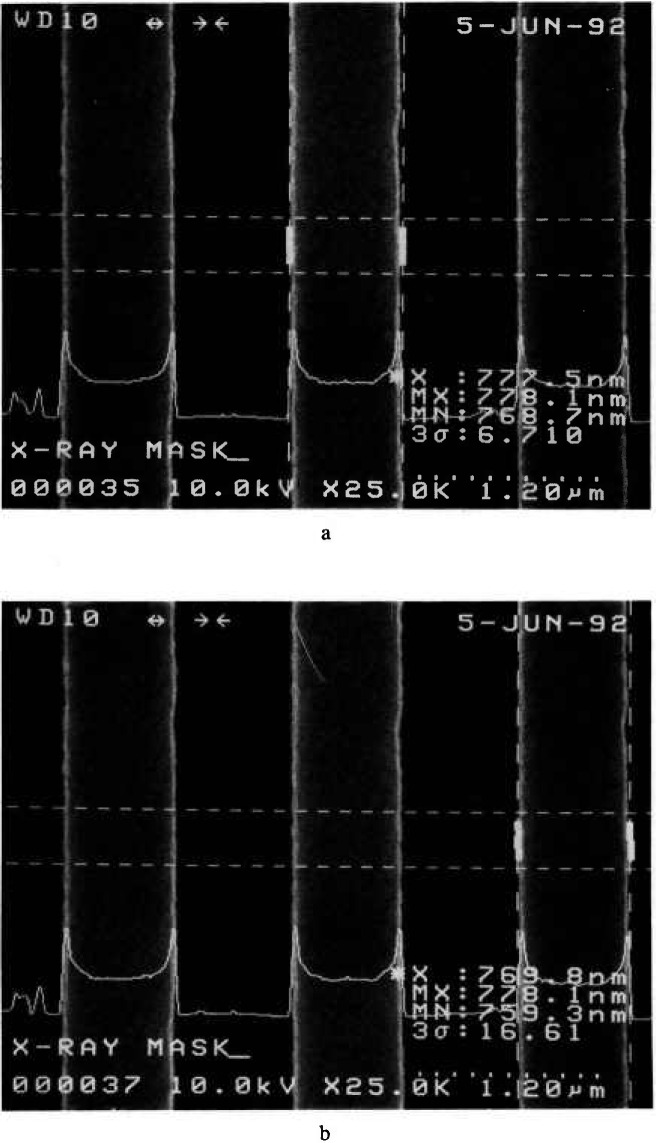
Fig. 15.
Scanning electron micrographs and beam scanned measurements of the gold absorber lines demonstrating the edge precision of the lines, (a) Position 1 and (b) Position 2. Note that depending upon the position on the absorber line where the measurement is taken, the 3σ value for the precision varies from 6.7–16.6 nm.

