FIGURE 1:
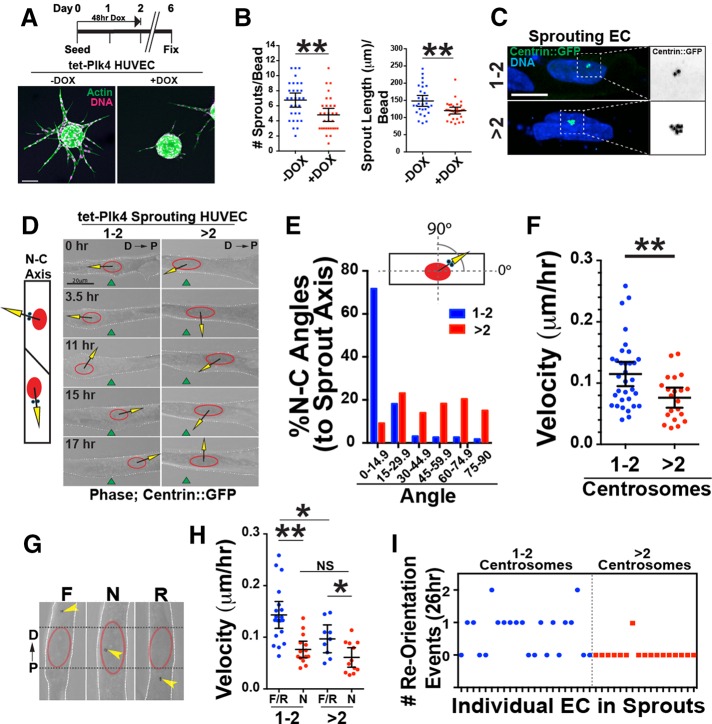
Excess centrosomes prevent centrosome repolarization. (A) Top, schematic of DOX treatment for Plk4 overexpression in sprouting HUVECs. Bottom, images of d6 sprouts stained for actin (phalloidin; green) and DNA (DRAQ; pink) with indicated treatments. Scale bar, 100 μm. (B) Scatter plots of sprouting parameters. –DOX, 22 beads; Plk4 + DOX, 29 beads. (C) Representative images of centrosomes in sprouting HUVECs infected with centrin::GFP– expressing virus (green) and stained for DNA (blue; 4′,6-diamidino-2-phenylindole). 1-2C, one or two centrosomes; >2C, more than two centrosomes. Right, area of higher magnification. Scale bar, 10 μm. (D) Left, diagram of nucleus (N)–centrosome (C) axis. Right, representative time-lapse images of HUVECs in sprouts expressing centrin::GFP, with N-C axis superimposed. D, distal (toward bead); P, proximal (toward sprout tip). Green fiduciary mark denotes starting position of the nucleus. Scale bar, 20 μm. (E) Histogram of N-C angles between groups (1-2C: 227 time points, 10 ECs; >2C: 186 time points, 10 ECs). (F) Scatter plot of mean velocity of individual HUVECs in sprouts. 1-2C: 33 ECs; >2C: 21 ECs. (G) Centrosome orientation classifications in angiogenic sprouts. D, distal; F, forward; N, nuclear; P, proximal; R, reverse. (H) Scatter plot of mean velocity of individual HUVECs in sprouts. F/R, forward/reverse. 1-2C: F/R, 19 ECs, and N, 14 ECs; >2C: F/R, 9 ECs, and N, 12 ECs. (I) Frequency of successful centrosome repolarization events per cell in indicated groups. For all experiments, black bars indicate comparison groups with indicated p values. Error bars are 95% confidence intervals. All p values are from two-tailed Student’s t test from at least three experiments. *p ≤ 0.05; **p ≤ 0.01; NS, not significant.

