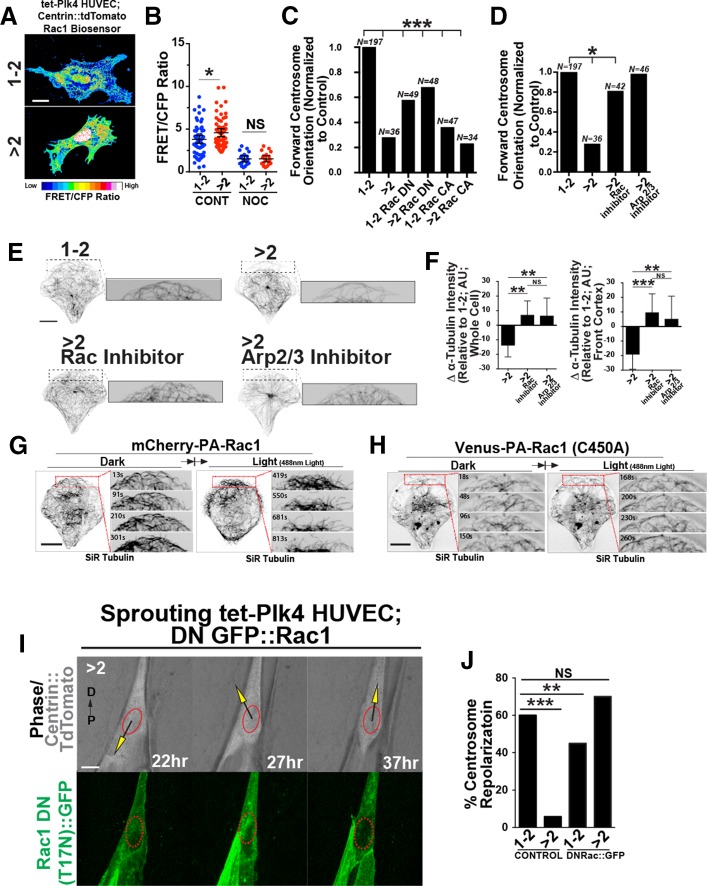
FIGURE 4:
ECs with excess centrosomes have ectopic Rac1 activation and centrosome orientation defects. (A) Images of EC with one or two (1-2C) or more than two (>2C) centrosomes expressing the Rac1 biosensor and pseudocolored to indicate Rac1 activity. Scale bar, 10 μm. (B) Scatter plot of average FRET/CFP ratios between EC with 1-2 or >2 centrosomes and with or without nocodazole treatment (NOC). –NOC: 1-2C, 60 ECs; >2C, 58 ECs. +NOC: 1-2C, 19 ECs; >2C, 19 ECs. (C) Percentage of forward-oriented ECs with indicated treatments between ECs with 1-2 or >2 centrosomes, normalized to controls. CA, constitutively active; DN, dominant negative. Comparisons are to 1-2C group by c2 analysis. (D) Percentage of forward-oriented ECs with indicated treatments between ECs with one or two or more than two centrosomes, normalized to controls. Rac inhibitor (NSC23766); Arp 2/3 inhibitor (Ck-666). Comparisons are to 1-2C group compared by c2 analysis. (E) Images of front cortex of HUVECs on micropatterns stained for α-tubulin; treatments as indicated. Scale bar, 10 μm. Right, higher magnification of leading edge. (F) Quantification of whole-cell and cortex MTs (α-tubulin intensity) with indicated treatments, normalized to 1-2C EC controls. >2C, 20 ECs; >2C + Rac Inh, 20 ECs; >2C + Arp 2/3 Inh, 18 ECs. Error bars, 95% confidence intervals. (G) Time-lapse images of a representative EC on micropattern expressing mCherry-PA-Rac1 without 488-nm light exposure (dark; left) and subsequent to light exposure (light; right). Red boxes, higher-magnification areas to left. Time is indicated in seconds. (H) Time-lapse images of a representative EC on a micropattern expressing Venus-PA-Rac1 (C450A) light-insensitive mutant in conditions similar to those in G. Red boxes, higher-magnification areas to left. Time is indicated in seconds. (I) Time-lapse images of EC in sprouts expressing centrin::tdTomato to mark centrosomes, GFP::Rac1 (DN), and N-C axis superimposed. Scale bar, 10 μm. (J) Percentage of sprouting ECs that repolarize with expression of DN Rac::GFP. Control: 1-2C, 22 ECs; >2C, 17 ECs. DNRac: 1-2C, 10 ECs; >2C, 12 ECs. All p values are from two-tailed Student’s t test from at least three experiments, unless indicated otherwise. *p < 0.05; **p ≤ 0.01; ***p ≤ 0.001; NS, not significant; N, number of ECs analyzed.

