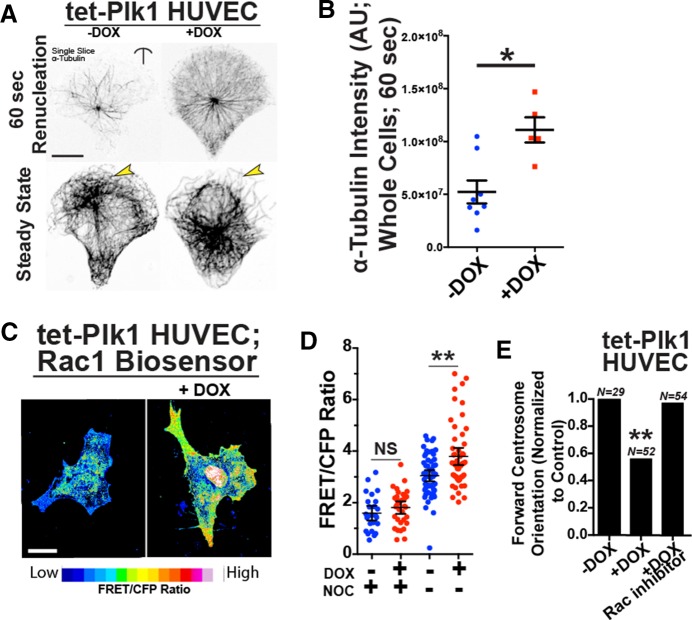
FIGURE 5.
Plk1 overexpression phenocopies excess centrosome defects. (A) Images of ECs expressing stabilized tet-inducible Plk1 without or with DOX treatment and stained for MTs (α-tubulin). Top, 60 s after cold washout, showing renucleated centrosome-derived MTs; bottom, steady-state MTs. Arrows denote differences in MT density between groups. (B) Scatter plot comparing α-tubulin intensity between control ECs (–DOX) and ECs expressing Plk1 (+DOX) 60 s after cold washout (two experiments). Scale bar, 10 μm. (C) Representative pseudocolored (to indicate Rac activity) images of ECs expressing DOX-inducible Plk1 and Rac1 biosensor. Scale bar, 10 μm. (D) Plot of FRET/CFP ratio between controls (–DOX) and ECs expressing Plk1 (+DOX) with or without nocodazole treatment (NOC). –DOX, 56 ECs; +DOX, 55 ECs. (E) Percentage of forward-oriented ECs with indicated treatments. Rac inhibitor (NSC23766). Comparisons are to –DOX control by c2 . N, number of observations. For all experiments, black bars indicate comparison with indicated p values. Error bars are 95% confidence intervals. All p values are from two-tailed Student’s t test from three experiments, unless indicated otherwise. *p ≤ 0.05; **p ≤ 0.01; NS, not significant.

