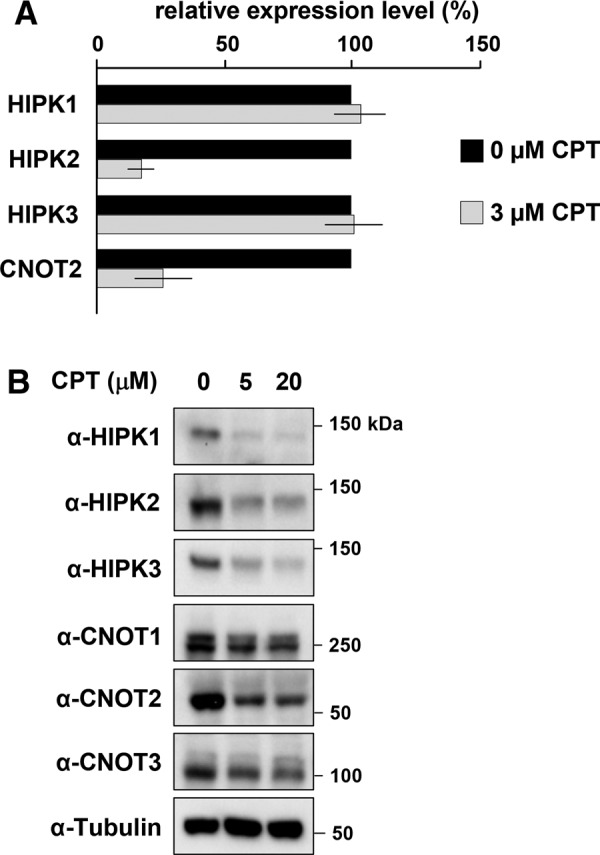
FIGURE 5:

CPT-mediated down-regulation of CNOT2 and HIPK2. (A) 293T cells were treated with indicated concentrations of CPT for 16 h. Total RNA was isolated, and mRNA levels of the indicated genes were analyzed with real-time qPCR using gene-specific primers. Error bars display the SDs from two independent experiments. (B) Cells were treated for 24 h with different concentrations of CPT, and the levels of the indicated proteins were detected by Western blot analysis using specific antibodies.
