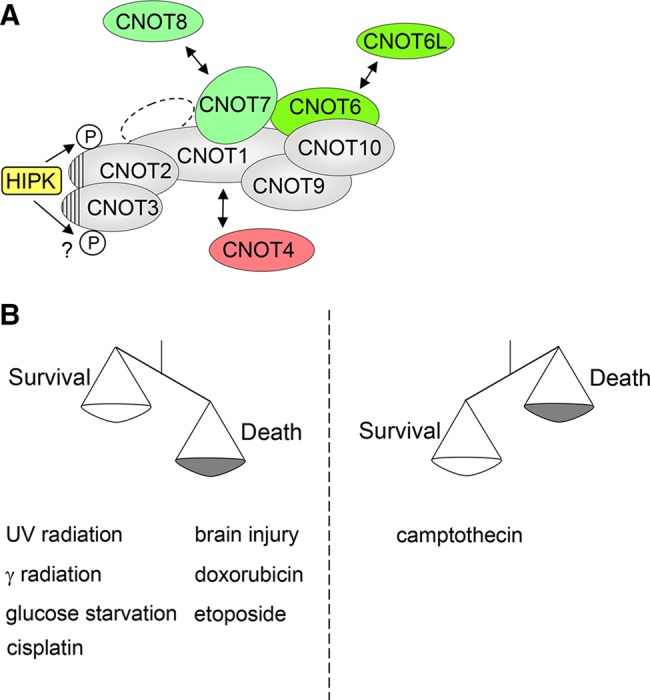
FIGURE 8:

Schematic models summarizing the results. (A) Association with and phosphorylation by the HIPKs. The NOT-boxes contained in CNOT2 and CNOT3 are indicated by striated areas. The subunits with deadenylation activity are shown in green, and the loosely associated subunit with ubiquitin E3 ligase activity is shown in red. (B) Schematic model showing the proapoptotic and antiapoptotic functions of HIPK2.
